Dogecoin (CRYPTO: DOGE) was trading about 1.5% lower on Friday, in sympathy with the cryptocurrency sector and the general markets, which saw Bitcoin (CRYPTO: BTC) and the S&P 500 trading down about 1.5% and 1.2%, respectively.
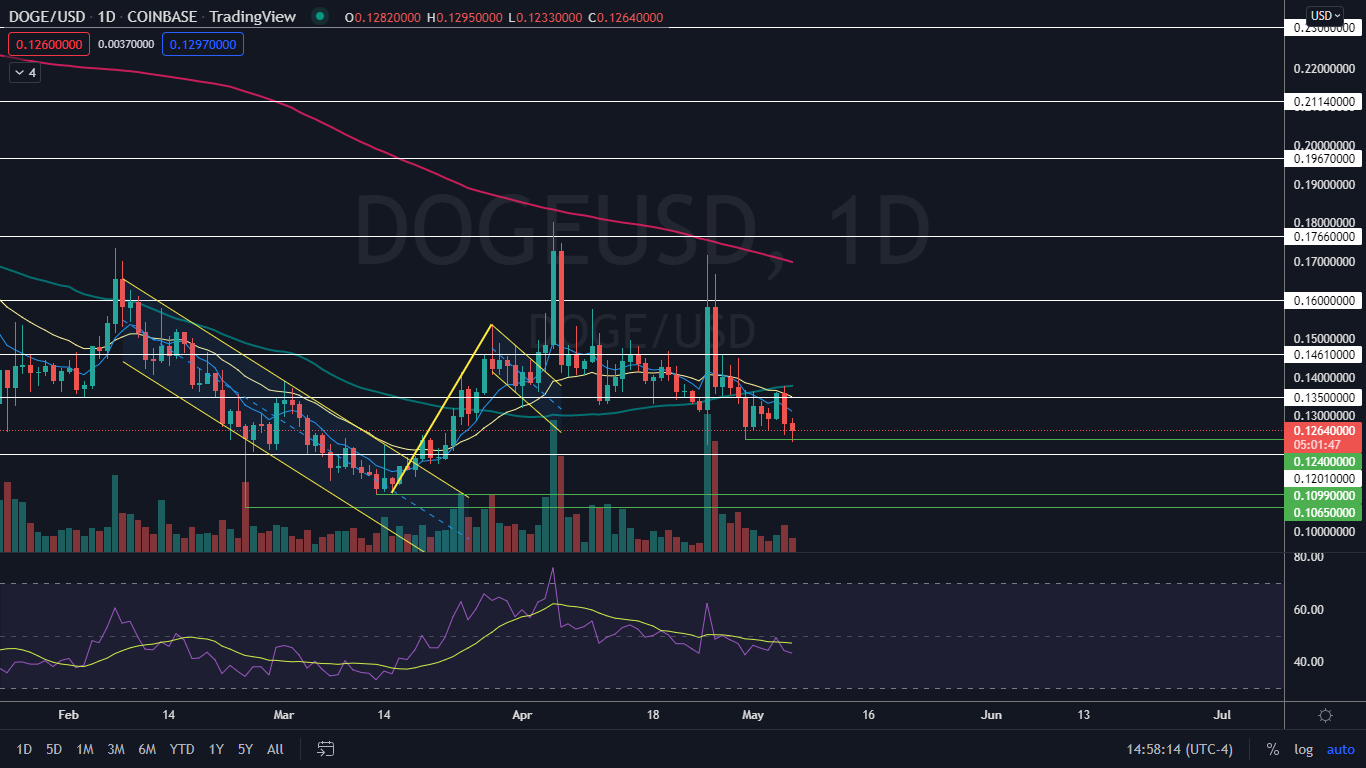
At press time, Dogecoin had bounced up from its low-of-day price, which caused the crypto to form a hammer candlestick patterns on the daily chart.
A hammer candlestick pattern forms when a red or green candlestick prints, with a long lower wick and a short upper body, which resembles a hammer.
A hammer candlestick, when found in a downtrend, can indicate a reversal to the upside is on the horizon. It is a lagging indicator, however, because the next candle on the timeframe being studied must print before the pattern can be validated.
A hammer candlestick doesn’t necessarily mean a new uptrend will occur, only that a bounce higher is likely imminent.
Candlestick patterns can be used to indicate the future price direction of a stock. Candlestick patterns are especially useful for technical traders when they are combined with other indicators such as larger patterns, trading volume, relative strength index (RSI) and divergences between RSI and price action.
Want direct analysis? Find me in the BZ Pro lounge! Click here for a free trial.
The Dogecoin Chart: As well as printing a hammer candlestick on Friday, Dogecoin may also be working to form a bullish double bottom pattern at the $0.124 level, when the price action is combined with similar price action on April 30. If the double bottom pattern is recognized along with the hammer candlestick, traders can expect a bounce over the weekend.
- The move lower on Friday was on lower-than-average volume, which indicates consolidation as opposed to fear selling. At press time, Dogecoin’s volume was measuring in at about 129 million on Coinbase compared to the 10-day average of 225.15 million.
- Dogecoin has resistance above at $0.135 and $0.146 and support below at $12 cents and the 10-cent mark.

See Also: Why Is Dogecoin Failling Sharply Today


