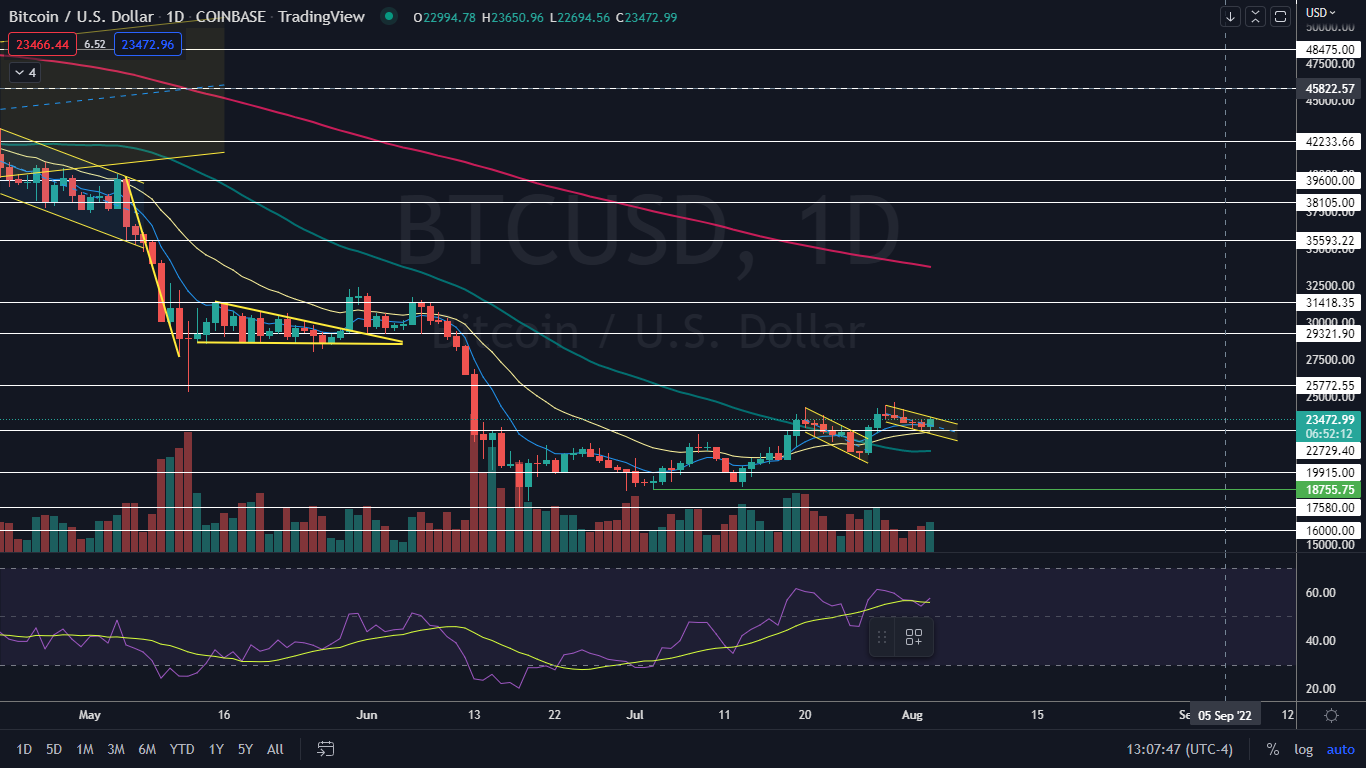
Bitcoin (CRYPTO: BTC) was trading about 2% higher at one point on Wednesday in continued consolidation after two bullish days on July 27 and July 28 saw the crypto soar up over 13% higher.
The surge on those two days was due to a bullish reaction of the general markets to the Federal Reserve’s decision to hike interest rates a further 0.75%. From a technical standpoint, however, Bitcoin broke up bullishly from a falling channel on the daily chart, which Bitcoin has formed into again recently.
The crypto has recently been trading in a descending channel pattern on the daily chart since July 29, making lower lows and lower highs between two parallel trendlines. The pattern is bearish for the short term, but can be bullish down the road.
For bearish traders, the "trend is your friend" (until it's not) and the stock or crypto is likely to continue downwards. Aggressive traders may decide to short the stock at the upper trendline and exit the trade at the lower trendline.
Bullish traders will want to watch for an upward break from the upper descending trendline, on high volume, for an entry. When a stock or crypto breaks up from a descending channel, it's a powerful reversal signal and indicates a rally is likely in the cards.
Want direct analysis? Find me in the BZ Pro lounge! Click here for a free trial.
The Bitcoin Chart: Although Bitcoin has confirmed a downtrend on the four-hour and eight-hour charts, a downtrend within the falling channel hasn’t yet been confirmed on the daily chart. If Bitcoin is unable to break up from the falling channel later during Wednesday’s 24-hour trading session, the high-of-day will serve as a lower high, confirming the downtrend on the larger time frame.
- On Wednesday, Bitcoin attempted to break up from the falling channel pattern but was failing, wicking from the upper descending trendline of the pattern. If Bitcoin closes the trading day near its high of day price, however, the crypto will print a bullish hammer candlestick, which could indicate higher prices and a break from the channel is in the cards for Thursday’s session.
- Bitcoin may also be working to print a bullish triple bottom pattern at the $22,730 level. If the pattern is recognized, it makes it more likely the crypto will break up from the falling channel pattern over the next few days.
- Bitcoin has resistance above at $25,772 and 28,321 and support below at $22,729 and $19,915.

- See Also: If You Invested $1000 In Bitcoin, Ethereum And Dogecoin 5 Years Ago, Here's How Much You'd Have Now


