Bed Bath & Beyond, Inc (NASDAQ:BBBY), CloudFlare, Inc (NYSE:NET) and Tesla, Inc (NASDAQ:TSLA) have all settled into bullish flag patterns on the daily chart. The bull flag pattern is created with a sharp rise higher forming the pole, which is then followed by a consolidation pattern that brings the stock lower between a channel with parallel lines.
- For bearish traders, the "trend is your friend" (until it's not) and the stock may continue downwards within the following channel for a short period of time. Aggressive traders may decide to short the stock at the upper trendline and exit the trade at the lower trendline.
- Bullish traders will want to watch for a break up from the upper descending trendline of the flag formation, on high volume, for an entry. When a stock breaks up from a bull flag pattern, the measured move higher is equal to the length of the pole and should be added to the lowest price within the flag.
A bull flag is negated when a stock closes a trading day below the lower trendline of the flag pattern or if the flag falls more than 50% down the length of the pole.
See Also: Tesla Fans Buy Times Square Billboard Promoting Tweet From Elon Musk: Will President Biden Notice?
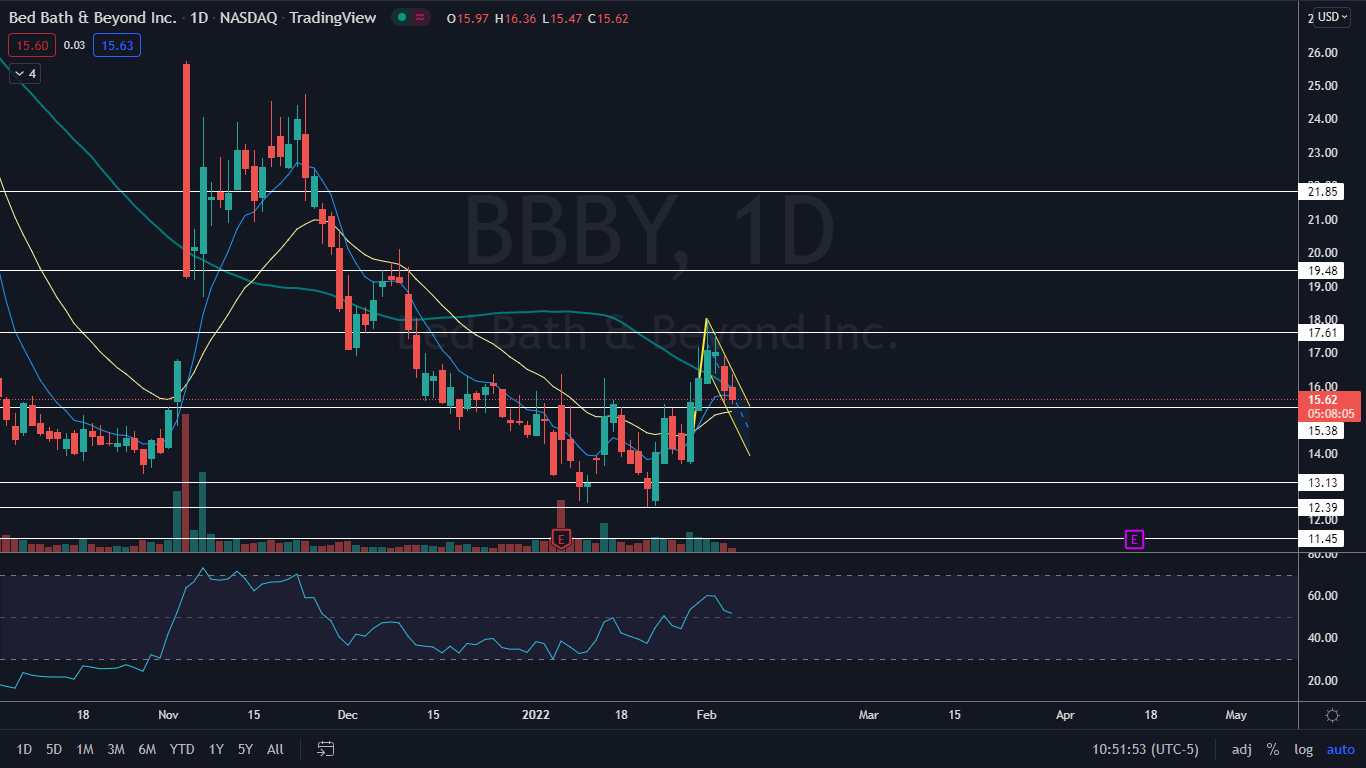
The Bed Bath & Beyond Chart: On Jan. 21 and Jan. 24, Bed Bath & Beyond printed a bullish double bottom pattern at the $12.39 mark and bounced up about 23% between Jan. 24 and Jan. 25. The stock then consolidated the move in a bull flag pattern and broke up from that pattern on Jan. 28.
- The break from the first bull flag, combined with the 18% move higher between Jan. 31 and Feb. 1 has created the pole in the current bull flag pattern, with the flag being formed over the trading days that have followed.
- If the pattern is recognized and Bed Bath & Beyond breaks up bullishly from it on higher-than-average volume the measured move is 32%, which indicates the stock could trade up toward the $20 mark.
- Bed Bath & Beyond has resistance above at $17.61 and $19.48 and support below at $15.38 and $13.13.
Want direct analysis? Find me in the BZ Pro lounge! Click here for a free trial.

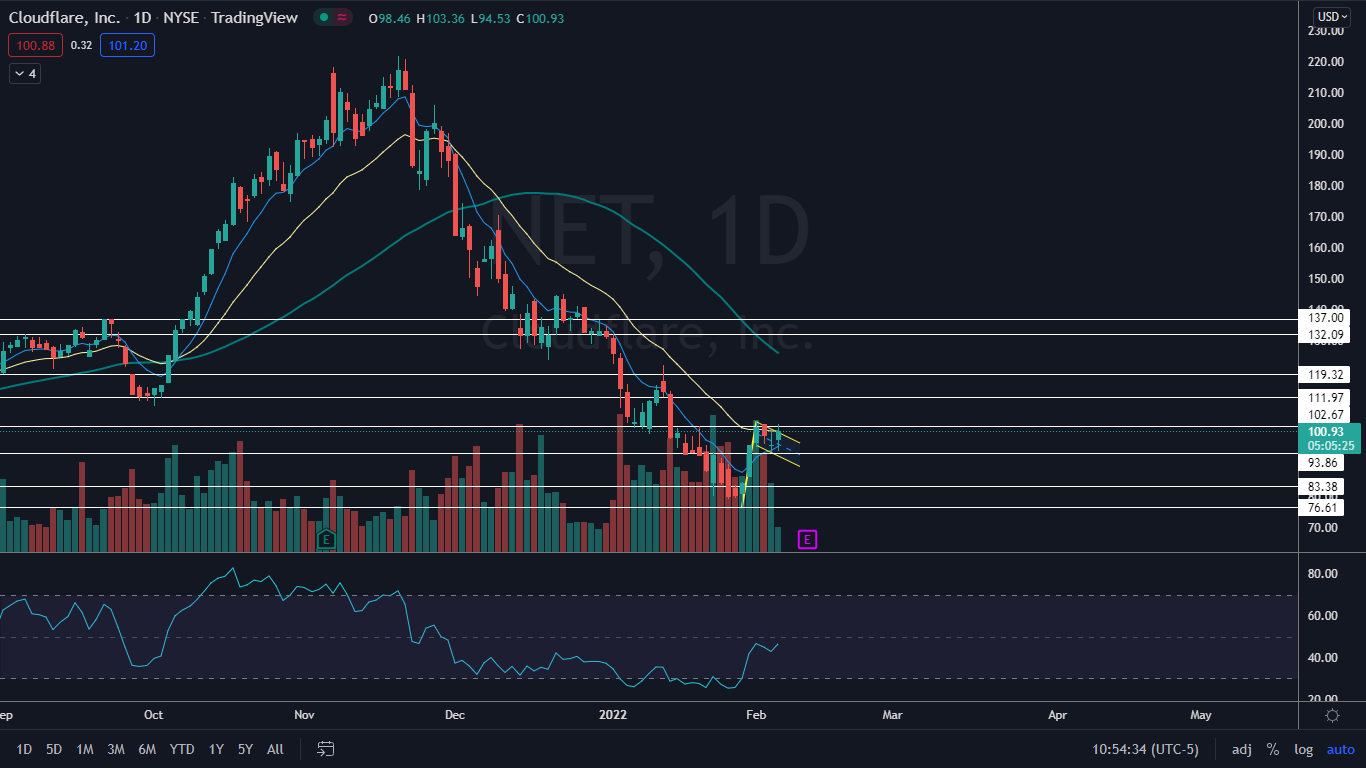
The Cloudflare Chart: On Friday, Cloudflare was attempting to break up bullishly from a bull flag pattern the stock has printed between Jan. 28 and Friday, with the pole created between Jan. 28 and Feb. 1 and the flag formed on the trading days that have followed.
- If the pattern is recognized, the measured move is about 33%, which indicates Cloudflare could trade up toward the $126 level.
- Cloudflare has resistance above at $102.67 and $111.97 and support below at $93.86 and $83.38.

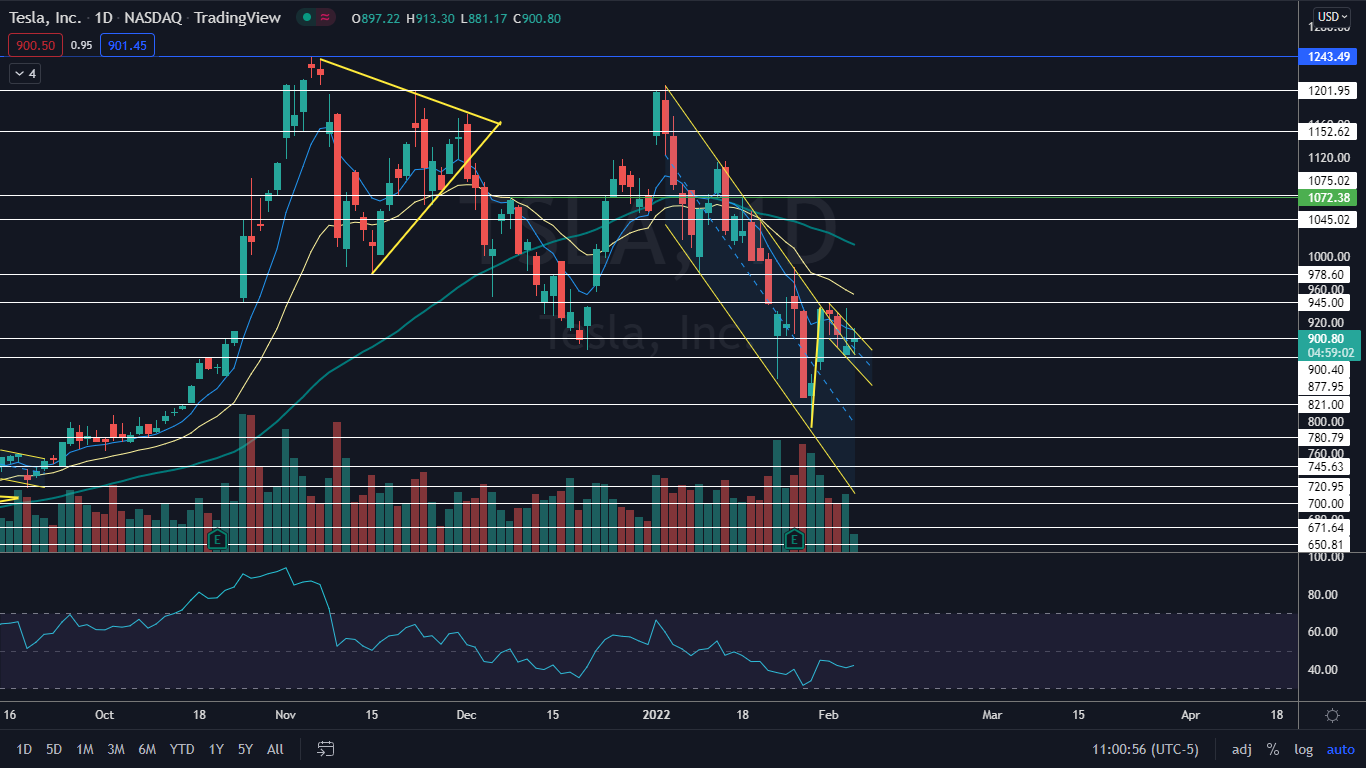
The Tesla Chart: On Feb. 1, Tesla broke up bullishly from a falling channel that had been holding the stock in a downtrend since Jan. 4. Since breaking up from the pattern, Tesla has been hovering near the upper descending trendline of the channel, which has created the flag of a bull flag pattern.
The measured move on a confirmed break of the pattern is roughly 18%, which indicates Tesla could rise up toward $1,042.
- On Friday, Tesla was also printing an inside bar pattern on the daily chart with its price action completely within Thursday’s price range. The pattern leans bullish because Tesla was trading higher before forming it.
- Traders can watch for both a break of the inside bar pattern and the bull flag pattern on higher-than-average volume to feel confident the patterns were recognized.
- Tesla has resistance above at $945 and $978 and support below at $877.95 and $821.


