Bank Of America Corporation (NYSE:BAC) opened slightly higher on Thursday, but immediately ran into a group of sellers and profit takers who dropped the stock down about 1% off the open.
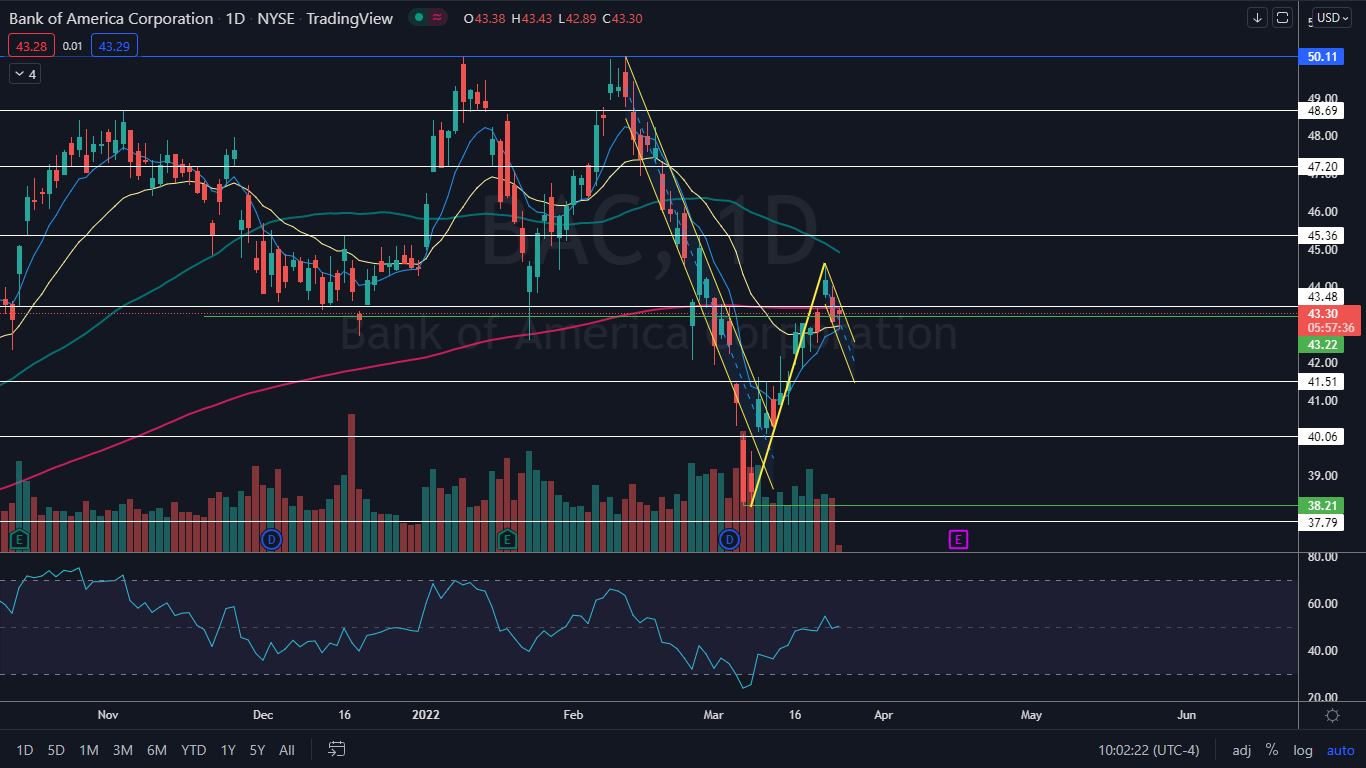
The bank, which is one of the largest in the U.S. with over $2.5 trillion in assets, has been volatile recently, reaching a new all-time high of $50.11 on Feb. 10 before entering into a steep downtrend, where the stock declined over 23% and bottomed at the $38.21 level on March 7 and March 8.
In the run up into the Federal Reserve’s monthly meeting, which took place on March 16 and March 17, Bank of America reversed course and began to swing to the upside.
Following the monthly meeting, Fed Chair Jerome Powell announced the central bank will target a .25bps to .5bps rate hike and expects to raise interest rates five additional times this year in order to combat soaring inflation. Banks are poised to benefit from rising interest rates because their profit margin on variable mortgages and new loans will increase.
In addition to the fundamental reasons that indicate Bank of America could trade higher, the stock has also settled into a bullish pattern on the daily chart, which implies a 17% move to the upside could be on the horizon.
See Also: Pete Najarian Prefers These Bank Stocks, Buys Calls
The Bank Of America Chart: Bank Of America has settled into a bull flag pattern on the daily chart, with the pole formed between March 7 and March 22 and the flag printing over the trading days that have followed. The measured move, calculated by adding the length of the pole, as a percentage, to the bottom of the flag, is 16.93%, which indicates the stock could trade back up toward the $50 mark.
Bank of America is also trading in a confirmed uptrend, with the most recent higher high created on March 22 at the $44.63 level and the most recent higher low printed on March 17 at $41.83. The stock may have printed another higher low on Thursday, but Friday’s candle will need to print before that can be confirmed.
If the stock closes the trading day at or above the $43.20 level, it will print a hammer candlestick on the daily chart, which indicates higher prices are likely to come on Friday. If Bank Of America closest the trading day below that level, it will print a bearish Marubozu candlestick, which could indicate the next higher low is not yet printed and lower prices will come on Friday.
Bank Of America is trading above the eight-day and 21-day exponential moving averages (EMAs), with the eight-day EMA set to cross above the 21-day, both of which are bullish indicators. The stock is trading below the 50-day simple moving average (SMA), however, which indicates longer-term sentiment is bearish.
Want direct analysis? Find me in the BZ Pro lounge! Click here for a free trial.
- Bulls want to see big bullish volume come in and break the stock up from the bull flag pattern, which will give Bank Of America room to regain the 50-day SMA as support. There is resistance above at $43.48 and $45.36.
- Bears want to see big bearish volume come in and break the stock down below the eight-day and 21-day EMAs, which could cause the stock to print a lower low and negate the uptrend. Bank Of America has support below at $41.51 and $40.06.