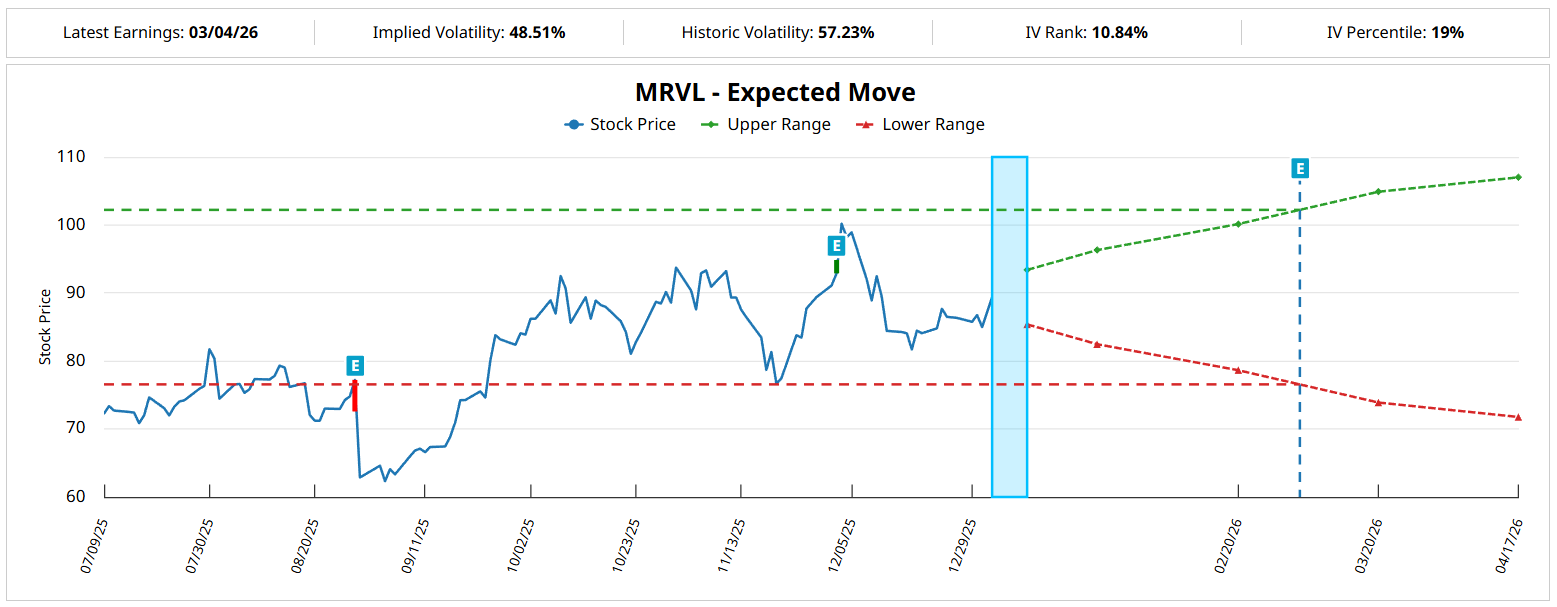
As a fabless designer and developer of analog, digital and mixed-signal processing integrated circuits, Marvell Technology (MRVL) represents one of the most important names amid the broader push in artificial intelligence. Not surprisingly, Barchart’s Technical Opinion indicator rates MRVL stock as a 96% Strong Buy. Over the past six months, MRVL has gained nearly 19% — but it could be much better had the performance not been as choppy as it was.
Like it or not, Marvell both benefits and suffers from non-ergodicity. Effectively, the actual performance outcome of MRVL stock might not match the anticipated long-term return. While the semiconductor specialist may be relevant, there are also brewing questions about the capital expenditures impacting machine intelligence. No one might be outright casting aspersions on AI but the sector has temporarily pivoted from a hypergrowth cycle to a “show-me” phase.
Amid broader economic concerns, investors want to be sure that their money is being used wisely. As such, there have been growing concerns about the prudence of excessive capital chasing after machine learning — no matter how profound the underlying narrative is.
Notably, this hesitation appears to have taken a toll regarding Marvell’s derivative market transactions. From Friday’s unusual options activity screener, the overriding motif has centered on volatility positioning as opposed to outright conviction. On Friday, the spot price was around $89.40 and the bulk of activity clustered around the $88 to $93 strike prices, particularly for short-dated options (with expiration dates of Jan. 9 and Jan. 16).
Interestingly, the open interest for most of these strikes was quite dense. Subsequently, this structure indicates that market participants are trading movement and mean reversion around the spot price. In other words, the underlying expectation is for small, controlled movements to materialize in either direction.
If any smart money traders were anticipating large directional moves, you would likely see heightened demand for far out-the-money (OTM) options. Among the most heavily transacted derivatives, you didn’t see this activity heading into the weekend.
Now, I don’t want to extrapolate the data longer term. But as circumstances stand right now, the smart money seems to have high confidence in uncertainty and low confidence in distance. This dynamic may play into the hands of data-driven traders.
Playing the One Advantage Retail Has Regarding MRVL Stock
As you might expect as a retail participant, anytime you place a wager, you’re effectively betting against an entity that enjoys a house advantage over you. However, you may be surprised to know that Wall Street’s strength may actually be a weakness that you may be able to exploit.
Technically speaking, market makers more or less must use monotonic modeling frameworks to assess risk at scale. What this means is that for every unit of distance away from spot that your target strike price is, the less likely the underlying outcome will materialize. To use a simple basketball analogy, a layup is much easier to make statistically than a three-pointer, all other things being equal.
Therefore, when you consider models like Black-Scholes or similar variants, the underlying risk always rises by some defined factor as distance from spot increases. That’s straight out of the structure of parametric models. However, the edge for retail is that — if traders so choose — they may elect asymmetric, non-monotonic models.
How does that work in practice? Let’s go back to our basketball analogy. While a layup is statistically easier than a three-point attempt due largely to the closer distance to the basket, the problem comes from in-game conditions. Sometimes, the route to making a layup could be well defended. At that point, the higher-probability setup could be passing the ball to the open player positioned just outside the arc.
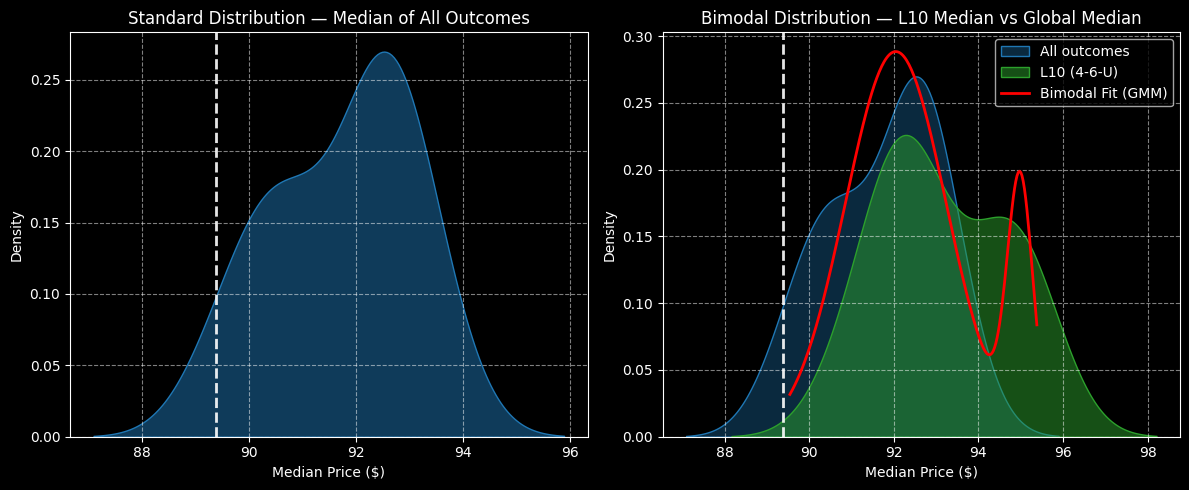
Similarly, I believe that while MRVL stock is not positioned closest to the basket, it is the one player that’s open. Structurally, MRVL in the past 10 weeks has printed only four up weeks but with an overall upward slope. This sequence — abbreviated as 4-6-U (four up, six down, upward trend) — typically extends the forward 10-week return range of $87 and $96 to a range between $88 and $98.
Moreover, probability density under 4-6-U conditions would be strongest between $91 and $95. Bullish speculators may therefore attempt to aim at this sweet spot.
Bringing Home the Point
It’s important not to lose sight of the beauty of non-monotonic risk modeling amid the analytical information above. What the data is telling us is that, under 4-6-U conditions, the chance that MRVL stock terminates at around $91 is about the same as a terminal projection of $95 over the next 10 weeks.
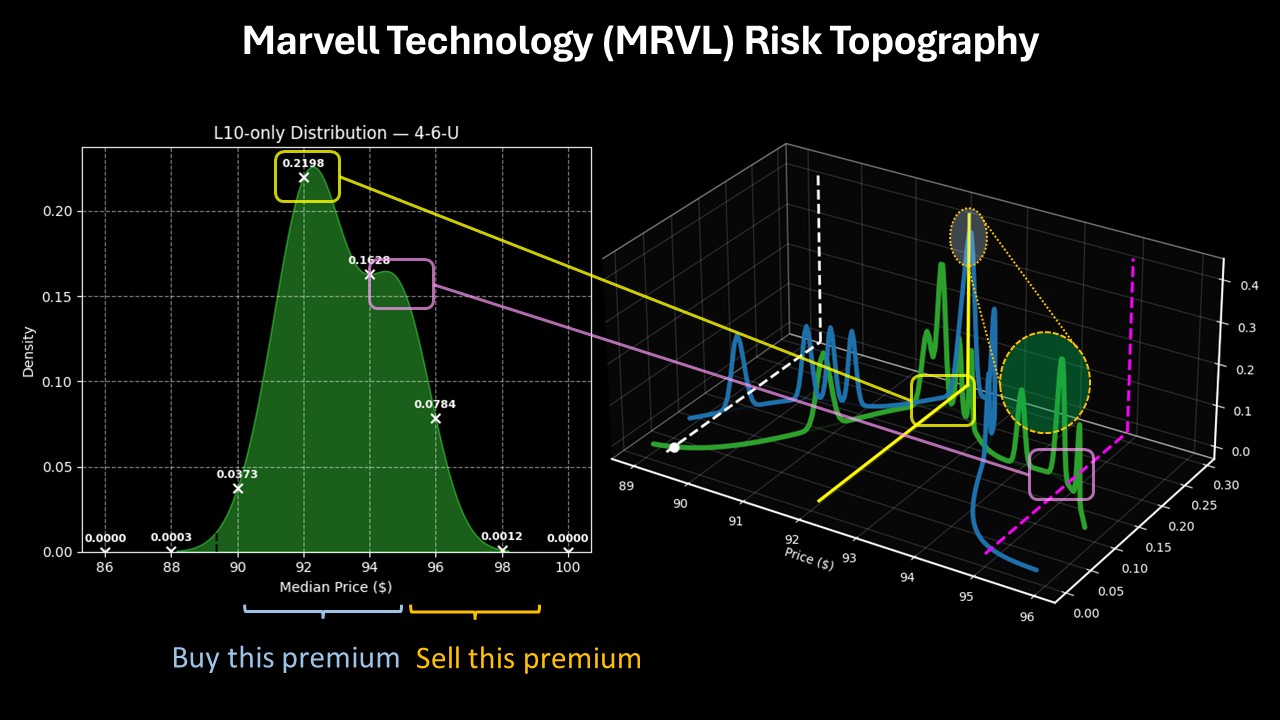
Under a monotonic framework, that would be considered ludicrous — like saying a three-pointer is easier to make than a layup. And in a clean environment with no defenders, the statement would indeed be absurd. However, in specific in-game conditions, the long shot may be your best bet because it’s uncontested.
With that in mind, I’m really digging the 90/95 bull call spread expiring Feb. 20, 2026. This trade requires MRVL stock to rise through the $95 strike price at expiration to trigger the maximum payout of roughly 133%, which appears to be a contextually realistic target. Better yet, the breakeven price of $92.15 adds probabilistic credibility to the wager.