Shares of Hewlett Packard Enterprise (HPE) are rallying on Thursday, up about 4% after the company reported better-than-expected earnings.
The rally isn’t blowing Wall Street away necessarily, but the stock is hitting a six-month high in the process.
That said, shares are on the move higher after the company delivered strong fourth-quarter results and provided upbeat guidance.
The environment for tech has not been good. High-growth names have been crushed, while quality names have seen declines in excess or 40% or more.
However, there’s a part of tech that’s actually holding up. Those are the low-valuation, dividend-paying stocks.
That includes Hewlett Packard Enterprise stock, but it also includes holdings like Texas Instruments (TXN), International Business Machines (IBM) and a few others.
With shares hitting a six-month high, let’s take another look at Hewlett Packard Enterprise stock.
Trading HPE Stock on Earnings

Chart courtesy of TrendSpider.com
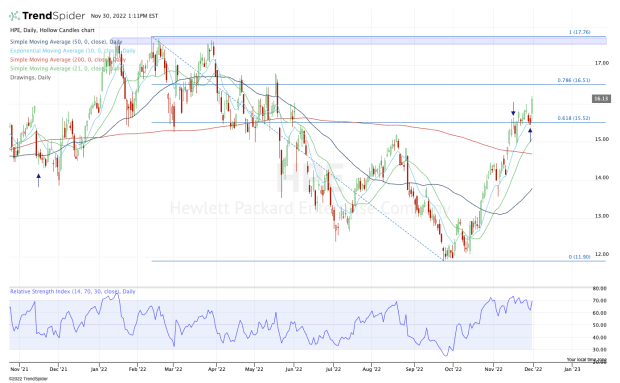
I love how Hewlett Packard Enterprise stock scorched higher off its September and October low and rode active support via the 10-day moving average.
Shares bombarded higher by more than 30% going into earnings and maintained support along the 10-day moving average. That price action is common in strong stocks, but there have not been many strong stocks in tech this year.
In any regard, earlier this month shares struggled with the 61.8% retracement near $15.50. The stock eventually pushed through this area, then found it as support ahead of earnings.
That’s an important development in trading, as we look for areas that turn from resistance into support.
In any regard, what now?
I want to see Hewlett Packard Enterprise stock hold above last week’s high near $16. If it can do that, it keeps the door open to the 78.6% retracement at $16.51.
Above that and the major resistance zone between $17.50 to $17.75 is in play. Ultimately, this is the level bulls want to see the stock reach.
On the downside, it’s simple. Investors want to see Hewlett Packard Enterprise stock continue to find the 10-day moving average as support while staying above $15.50.
If those measures fail, it may put the 21-day moving average in play, but we’ll want to re-evaluate the charts if it loses the 10-day and $15.50 level.


