Bitcoin (CRYPTO: BTC) was trading flat during Wednesday’s 24-hour trading session, in tandem with the S&P 500, which closed 0.29% higher on Wednesday.
Ethereum (CRYPTO: ETH) and Dogecoin (CRYPTO DOGE) followed suit, trading flat to the Tuesday session’s closing price. The three cryptos have had multiple days of decreasing volume, which indicates a lack of both buyers and sellers.
The lack of buyers and sellers is due to a current lack of interest. Crypto traders and investors may be waiting to see how the general markets react when Federal Reserve chair Jerome Powell takes the stage at the Jackson Hole Symposium at 10:00 a.m. on Friday.
Powell’s speech is expected to center around soaring inflation, and traders and investors will be listening closely for hints at how the Fed plans to continue attempting to tackle rising costs when it meets in September.
Powell’s tone is likely to ignite volatility in the markets, which will come with increasing volume. Crypto traders and investors will be watching closely to see which way the S&P 500 and the top cryptos begin to move once the speech begins.
Want direct analysis? Find me in the BZ Pro lounge! Click here for a free trial.
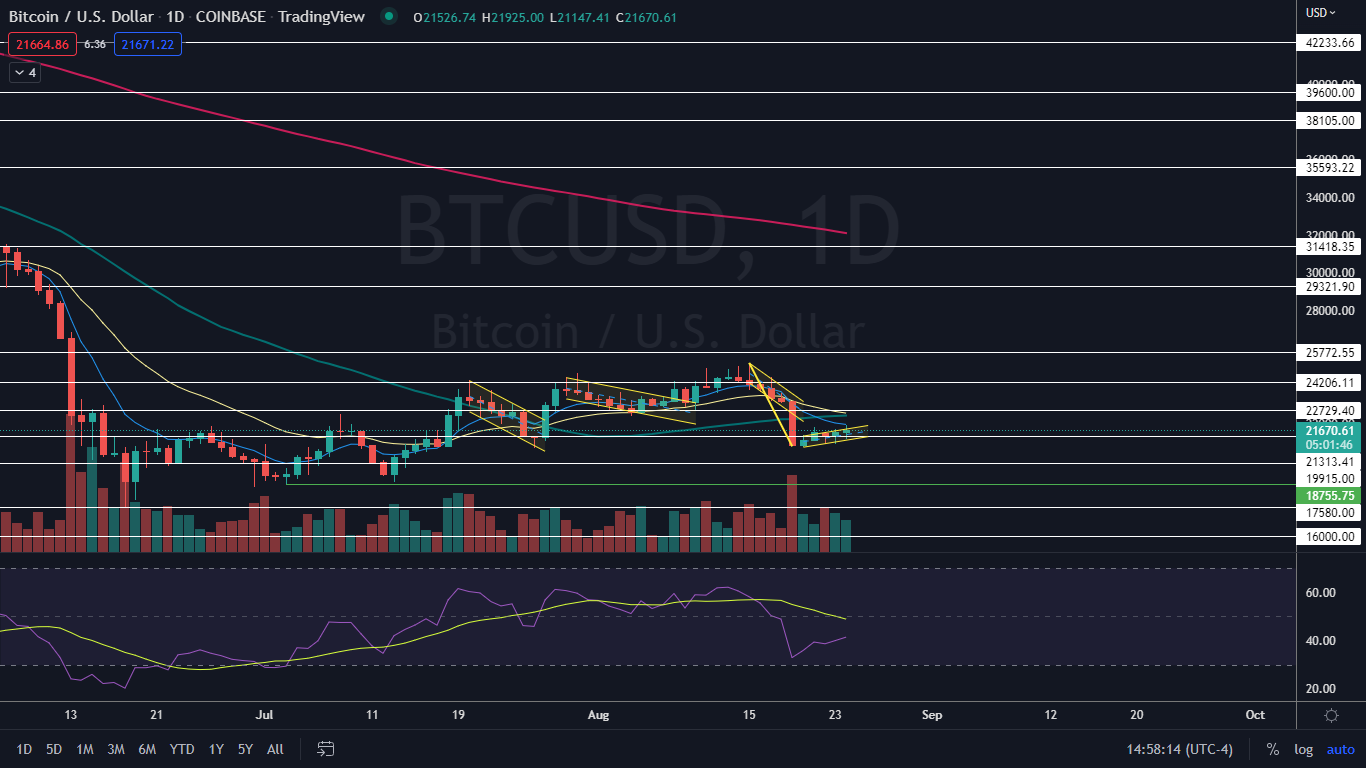
The Bitcoin Chart: Bitcoin has been trading in a slight uptrend since Aug. 20, with the most recent higher low formed during Tuesday’s trading session at $20,889 and the most recent confirmed higher high printed at the $21,795 mark on Aug. 21.
The recent uptrend combined with the 18% decline between Aug. 15 and Aug. 19 may have settled the crypto into a bear flag pattern on the daily chart. If the pattern is recognized, bearish traders will want to see the crypto drop down through the lower ascending trendline of the flag formation on higher-than-average volume to indicate the pattern was recognized.
If bulls come in and drive the stock up over the eight-day exponential moving average (EMA), the bear flag will be negated, and a larger uptrend may form. The lower wicks on Bitcoin’s daily candlesticks within the flag formation indicate support exists within the flag pattern, which may indicate the formation isn’t recognized.
Bitcoin has resistance above at $22,729 and $24,206 and support below at $21,313 and $19,915.

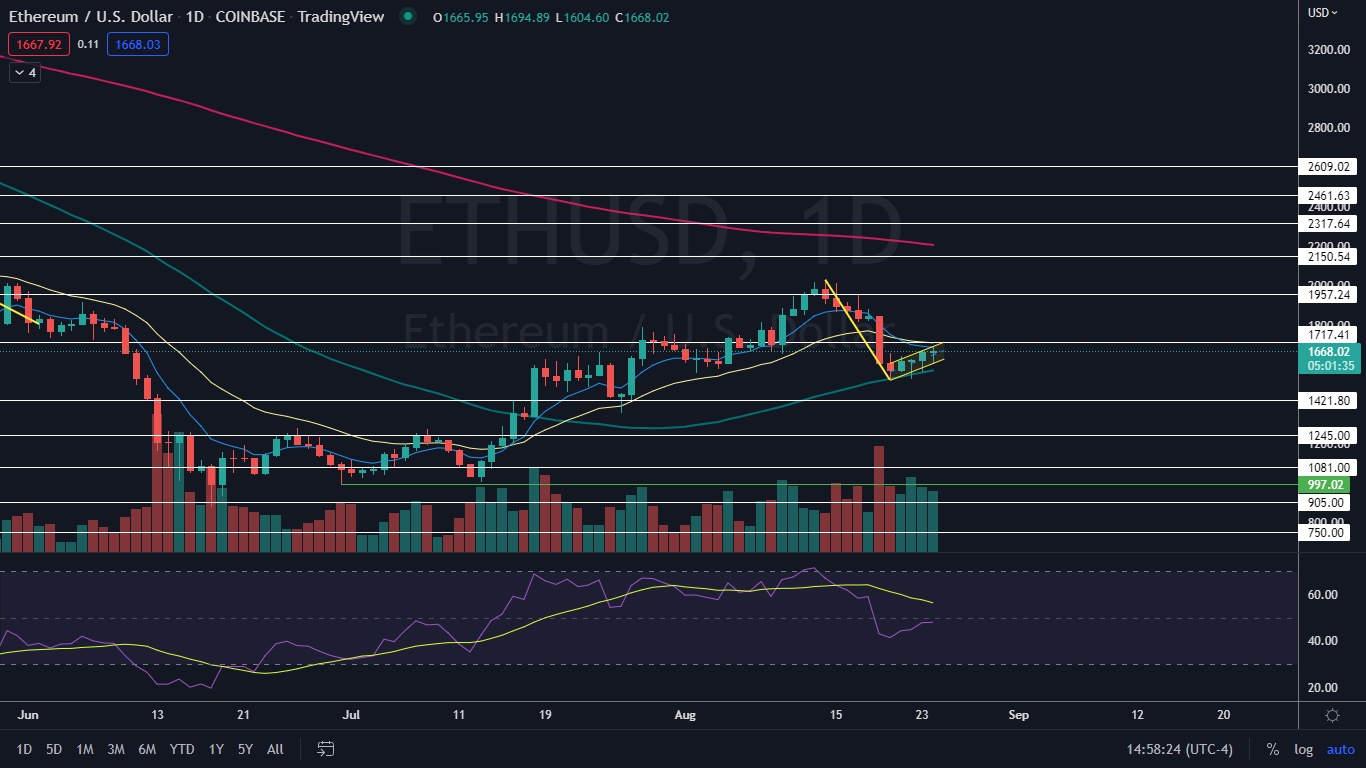
The Ethereum Chart: Ethereum’s chart looks almost identical to Bitcoin’s chart, with a recent uptrend forming the flag of a bear flag pattern. Ethereum’s possible bear flag pattern began with the pole forming between Aug. 14 and Aug. 20 and the flag forming over the days that have followed.
During Wednesday’s 24-hour trading session, Ethereum attempted to regain support at the eight-day EMA, but rejected the level. Like Bitcoin, the lower wicks on Ethereum’s candlesticks in the flag indicate support below.

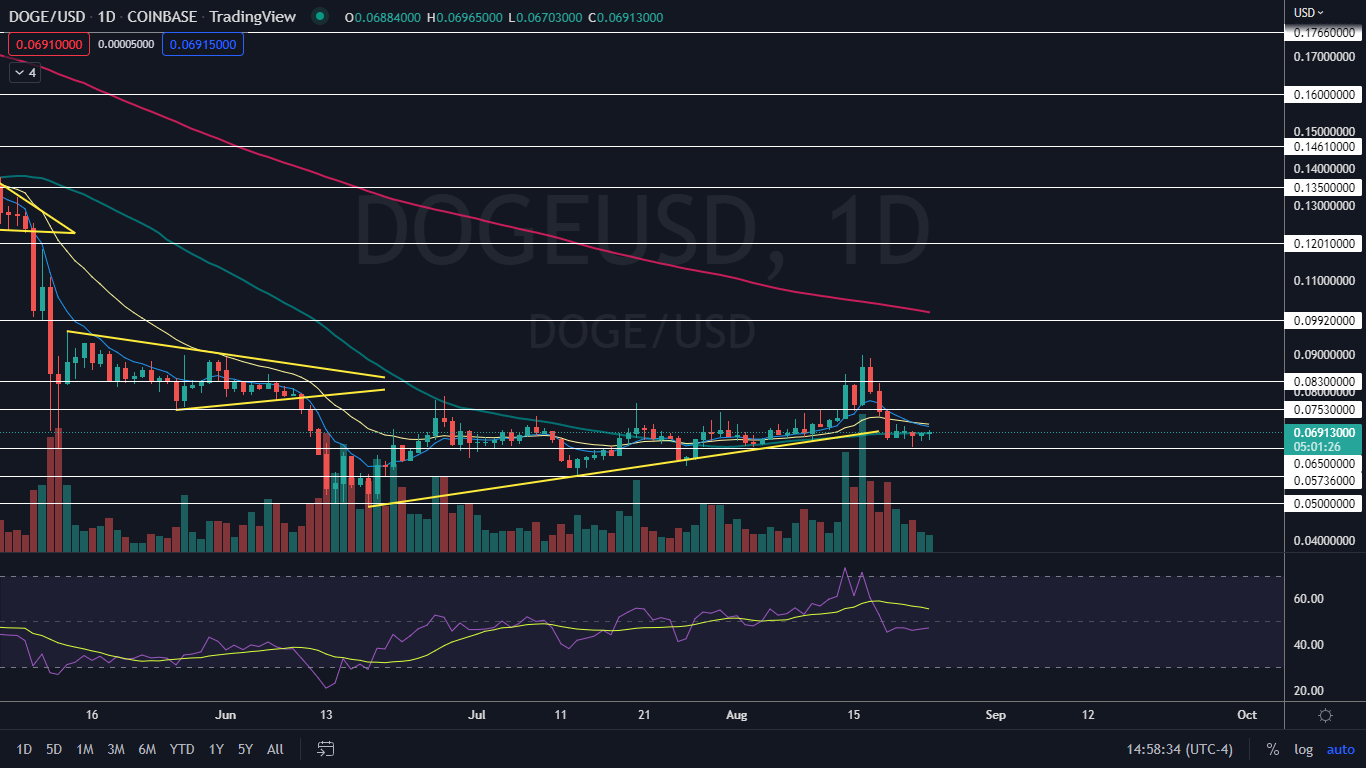
The Dogecoin Chart: Dogecoin may also be working to complete a bear flag pattern, with the pole formed between Aug. 17 and Aug. 29 and the flag forming over the days that have followed. Like Bitcoin and Ethereum, the lower wicks on Dogecoin’s chart indicate support below, which may help to negate the flag.
During Wednesday’s trading session, Dogecoin was printing an inside bar pattern, with all of the daily price action taking place within Tuesday’s range. Traders can watch for Dogecoin to break up or down from Tuesday’s mother bar on higher-than-average volume later on Wednesday or on Thursday to gauge future direction.
Dogecoin has resistance above at $0.075 and $0.083 and support below at $0.065 and $0.057.

See Also: So Is Dogecoin Heading Back to 5 Cents Or Making A Run To 10 Cents? Study Says...


