Bank of America Corp (NYSE:BAC) was surging more than 7% off the open on Thursday, in tandem with the general markets, which saw the S&P 500 trading about 2.6% higher.
The Labor Department reported an 8.2% year-over-year increase in the consumer price index for September, which caused many stocks to gap down Thursday. However, bullish volume came into the S&P 500 intraday, causing the market to spike higher, in a contrarian reaction.
Despite the Federal Reserve implementing a series of large interest rate hikes over the last nine months, inflation has remained high.
RSM US Chief Economist Joseph Brusuelas said the elevated inflation print implies that another "supersize Fed rate hike" is coming in November, which could bring the stock market lower and add further pressure on the banking sector.
When interest rates rise and the Fed raises rates, it costs more for banks to borrow money from the Federal Reserve, which can squeeze profits. When interest rates rise there are also fewer borrowers, which means less business for banks.
The bearish news on inflation didn’t hamper the bull rally on Thursday, because many stocks and the S&P 500 were trading near oversold territory, which suggested a bounce is likely.
Want direct analysis? Find me in the BZ Pro lounge! Click here for a free trial.
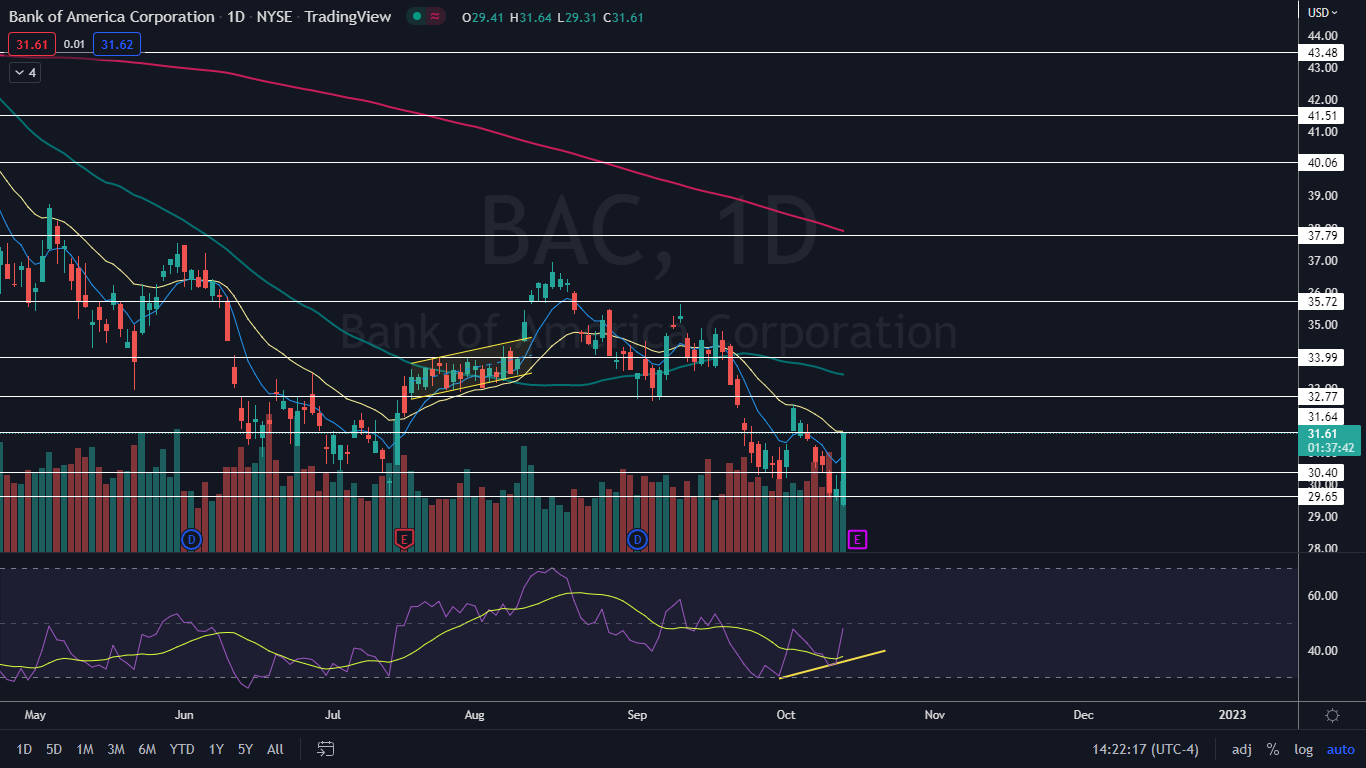
The Bank of America Chart: Bank of America reversed into its most recent downtrend on Aug. 17. The stock printed its most recent lower high on Oct. 4 at $32.52 and formed its most recent lower low at $29.31 on Thursday.
- On Thursday, Bank of America was working to print a big bullish engulfing candlestick on the daily chart and if the stock closes near its high-of-day, higher prices could come again on Friday. If the stock runs into sellers and closes the day with an upper wick, the next lower high may occur, which could indicate lower prices or an inside bar will come on Friday.
- Technical traders may have anticipated a bounce was the most likely scenario. That's because while Bank of America was trading near oversold territory with a relative strength index of about 35% on Wednesday, bullish divergence had also occurred on the stock’s chart. A bullish divergence occurs when a stock makes a series of lower lows but the RSI indicator makes a series of higher lows.
- Bank of America has resistance above at $31.64 and $32.77 and support below at $30.40 and $29.65.


