malamus-UKfrom Getty Images Signature; Canva
What Is the Personal Consumption Expenditures Index (PCE)?
What are people spending their hard-earned paychecks on? While prices constantly change, and some may go up while others go down, monitoring personal expenditures is a great way to gauge how prices are trending over time—because when people can afford to buy fewer everyday things, that means inflation is on the rise.
But inflation itself is notoriously hard to measure, which is why economists often look to several consumer and producer price indexes in order to get a complete picture. Each month, the Bureau of Economic Analysis publishes a series of price indexes that helps measure inflation in concrete terms:
- The GDP Price Index tracks changes in the prices of products manufactured in the United States.
- The Gross Domestic Purchases Price Index measures changes in prices paid by businesses, and it also includes imports.
- The Personal Consumption Expenditures Index (PCE) is a narrower slice of the overall Gross Domestic Purchases Price Index. It measures inflation in consumer terms. It also illustrates trends in consumer behavior. For example, if the price of beef rises, buyers might choose chicken instead, and so the expenditures in this report change frequently to keep pace with consumer trends.
When (and How Often) Is PCE Data Released?
The PCE is published along with data about personal income in a report called the Personal Income and Outlays report, which is released on the last Friday of each month at 8:30 AM ET.
What Does the Personal Consumption Expenditures Index (PCE) Measure? How Do You Calculate It?
The PCE measures changes in the prices of services and goods purchased by U.S. consumers. It includes everything from furniture and clothing to food, housing, electricity, gas, health care, educational expenses, insurance, and transportation.
The Core PCE excludes food and energy costs since they often have greater volatility than other expenses, and thus their prices shift with more frequency and velocity. Such shifts make it more difficult to accurately gauge inflation trends, which is why they are left out.
In addition, the individual components of the PCE are weighted differently; for example, gas prices have a bigger impact on the total PCE than, say, fruits and vegetables, because gasoline represents a larger portion of a consumer’s total spend.
To calculate the index, the BEA analyzes data from the U.S. Census and other government agencies as well as reports from private organizations like retail trade associations. It then separates consumer goods into three categories:
- Durable goods: This category includes motor vehicles, furniture, and other household goods.
- Non-durable goods: Items in this category have a lifespan of three years or less—this includes perishable items, such as food, as well as energy costs.
- Services: This category encompasses everything from housing to insurance, health care, and transportation.
The total amount of each category of goods and services is then calculated before it is “normalized” through a price deflator. This sets a baseline year that is used to compare with current prices and helps to determine the rate of inflation. The baseline year the BEA currently uses is 2012.
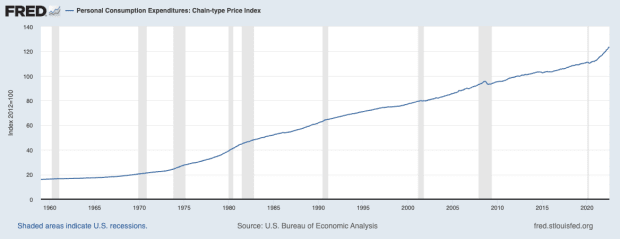
The chart below illustrates changes in consumer prices on a normalized basis from 1960 to 2022 (grey areas indicate periods of recession).

U.S. Bureau of Economic Analysis, Personal Consumption Expenditures: Chain-type Price Index [PCEPI], retrieved from FRED, Federal Reserve Bank of St. Louis; https://fred.stlouisfed.org/series/PCEPI, September 25, 2022.
How Is the PCE Similar to the Consumer Price Index (CPI)? How Is It Different?
Both the PCE and the Consumer Price Index (CPI) measure inflation, but the pricing data for the CPI comes from household surveys, while the PCE sources its data from a survey of businesses, and so many believe it may be more accurate.
The scopes of the indexes also differ. There are some items in the PCE that are not included in the CPI; for instance, the CPI measures out-of-pocket medical expenses, while the PCE includes both out-of-pocket expenditures as well as medical care paid for by employers and the government—which can be a big cost difference.
What Is the Fed’s Preferred Inflation Indicator?
Some might think the CPI is the best way to gauge inflation, but the Federal Reserve disagrees. In January 2012, it announced that it would be adopting the PCE as the primary inflation measure upon which it bases its monetary policy decisions.
The Fed chose the PCE because it is both a broader and timelier measure. The CPI doesn’t account for consumers making substitutions when the prices of goods and services are rising, while the PCE does. In a 1996 study called The Boskin Report, which was commissioned by the Senate Finance Committee, biases in the cost-of-living component of the CPI were revealed. The Committee recommended moving away from a “fixed basket” of goods and services, which tends to overstate inflation levels, and instead adopting a substitution model, which is similar to what is used in the PCE.
For these reasons, the PCE is often referred to as the Federal Reserve’s preferred inflation gauge.


