tazytaz from Getty Images Signature; Canva
What Is the October Effect?
What goes bump in the night? According to some investors, it’s the stock market in October.
As early as the 19th century, author Mark Twain took note of the October Effect, writing in his novel, Pudd'nhead Wilson, “October. This is one of the peculiarly dangerous months to speculate in stocks,” before humorously adding, “The others are July, January, September, April, November, May, March, June, December, August, and February.”
While many investors fear October as a time of rollercoaster-like volatility, grim investor sentiment, and precipitous declines—things might not be as scary as they think. Yes, the month experienced Wall Street’s biggest stock market crashes, but historically speaking, September is actually the month of the S&P 500’s worst performance. In fact, investors bold enough to spot buying opportunities resulting from the October effect might even finish the month holding more treats than tricks.
How Many Stock Market Crashes Have Happened in October?
Just how did October get such a frightful reputation? Some of the biggest market crashes have occurred in October:
- The Panic of 1907, caused by speculation in the copper sector, began on October 14, 1907. Up until this time, whenever there was a financial crisis, investors would literally run to the bank and withdraw their deposits. This devastated the banking industry since many kept low cash-to-deposit ratios with little regulation. The crisis spurred greater oversight of the financial markets and eventually led to the formation of the Federal Reserve.
- The Great Crash of 1929, the most severe stock market crash in history, actually began in September, but its three worst days took place on October 24th, October 28th, and October 29th. These days later became known as “Black Thursday,” “Black Monday,” and “Black Tuesday,” and accounted for more than a 30% drop in the Dow Jones Industrial Average. Unusually heavy trading volume delayed ticker tape reporting around the country, causing mass confusion on trading prices and capitulation. A slowing economy, excessive speculation, and overextended margin had all added fuel to the fire, and the decade-long Great Depression would be the result.
- Another “Black Monday” event happened on Monday, October 19, 1987, when market volatility mounted following reports of negative U.S. trade deficits and a weakening dollar. Trading delays in the options market served to accelerate the market’s already rapid sell-off, causing the Dow to fall 22.6% in one day. Taking a lesson from the event, circuit breakers were added into trading systems, which would be triggered at certain thresholds and automatically halt the system before further selloffs could occur.
- The S&P 500 plummeted 20% in just one week in October 2008, during the global Financial Crisis, which was caused by millions of U.S. homeowners defaulting on their subprime mortgages due to a lack of oversight on mortgage securitization in the investment banking industry.
Is the October Effect Real?
According to Sam Stovall, Chief Investment Strategist at market research firm CFRA, October is 36% more volatile than the average of the other 11 months of the year. But when his firm analyzed S&P 500 monthly performance since 1945, a very different picture emerged.
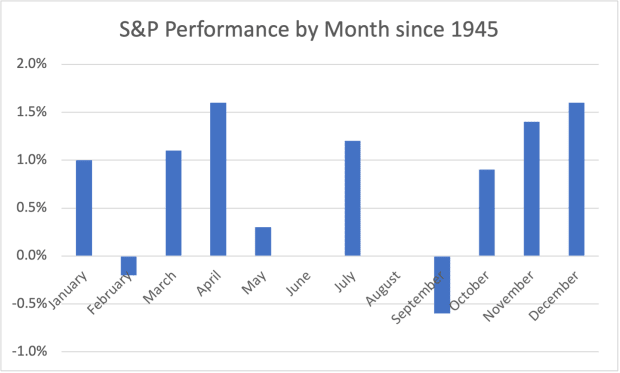
The months of February and September have historically yielded negative returns while June and August remained unchanged. As for October? It actually posted an average monthly gain of 0.9%, making it one of the best-performing months out of the entire year!
S&P 500 Average Monthly Performance Chart (1945–Present)
Why does the belief persist that October is a bad month for investors? Yes, October is marked by heightened volatility, and drastic price swings can often result from macroeconomic factors like inflation, rate hikes, and industry-specific issues. But volatility can also stem from psychological effects, such as greed and fear, just as much if not more so than from real-time economic indicators.
20th-century economist John Maynard Keynes believed that much of the investing world was driven not by data but rather by emotion and expectations—in fact, he even coined a term to describe this phenomenon: Animal spirits. Investors often use feelings and instincts to make their buy or sell decisions and act in a herd mentality. Multiply one investor’s knee-jerk reactions by thousands if not millions to produce a complete picture of any given market action, and you can see how emotions can create speculation, asset bubbles, selloffs—and worse.
How Can I Prepare My Portfolio for the October Effect?
Savvy investors can mint a profit from the October effect by keeping a cool head and identifying buying opportunities arising from the anxiety.
For instance, traders, like momentum investors, can turn to leading indicators like the Daily Sentiment Index (DSI), which gauges sentiment in the futures markets and can help predict where the broader stock market might open. By being aware of sentiment levels, traders can tell when a trend is about to shift—and thus devise strategies to profit.
Who Has Profited From the October Effect?
Legendary fund manager Peter Lynch often gained “one up” on Wall Street (and wrote a book by the same name) by keeping a close eye on stock fundamentals, like P/E ratios, which he believed were great indicators of oversold markets.
And while his Fidelity Magellan fund went from $10.7 billion to $7.7 billion in one day alone on Black Monday 1987, he used the post-crash period as a buying opportunity, scooping up deeply discounted shares of Chrysler, Goodyear, Intel, and Texas Instruments, to name a few—and the Magellan fund ended the year with a 2% gain. When Lynch retired in 1990, his fund had generated an annualized return of 29.2% for the 13 years he managed it, which was more than double the performance of the S&P 500.