What Is a Diffusion Index?
A diffusion index is a metric used to show the dispersion of change relative to a reference point, and a series of data can demonstrate whether there are upward or downward trends.
Diffusion indexes are commonly used to highlight results from a survey. Responses are in the form of values, and depending on those values, a base number is designated. Many indicators use a baseline of 0, 50, or 100. A series of data shows how far results are from the baseline. While a datapoint not far from the base number would indicate little change, a datapoint far from the base could suggest a significant change.
In economics, the diffusion index is used in the formulation of indicators, such as purchasing managers’ indexes and the Richmond Manufacturing Index. Unlike economic indicators, in which the data are based on prices or units, those that use a diffusion index are based on surveys. And depending on how the survey questions are framed, the diffusion index can be used as a tool for prediction, in the same way that the PMI is considered a leading economic indicator.
How to Calculate a Diffusion Index
There are different ways in which a diffusion index is calculated, and the formula can be either in long or short form.
Federal Reserve Formula
The Federal Reserve uses the basic formula for calculating a diffusion index. This formula is used in calculating indexes for many indicators among the Fed’s 12 regional banks, including surveys by the Richmond and Kansas City Feds.
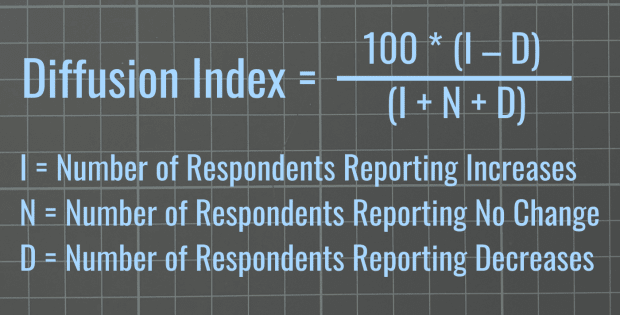
Diffusion Index = [100 * (I − D)] / (I + N + D)
I = Number of Respondents Reporting Increases
N = Number of Respondents Reporting No Change
D = Number of Respondents Reporting Decreases
IHS Markit Formula
IHS Markit, a research group that publishes purchasing managers’ indexes on the U.S. and other countries, has its own formula, which is different from the Fed’s.
IHS Markit’s Diffusion Index = (% Reporting ‘Up’) + [0.5 * (% Reporting ‘the Same’)] + [0.0 * (% Reporting ‘Down’)]
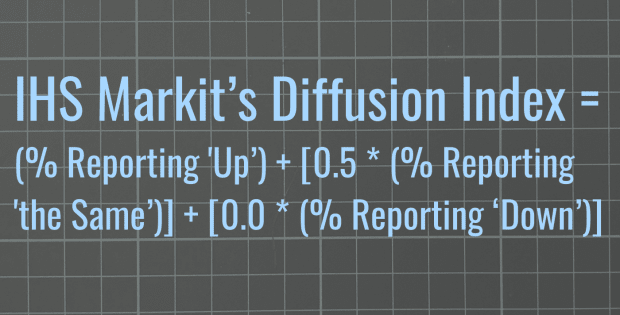
That can be expressed in short form as:
Index = Percentage of Positive Responses + 0.5 (Percentage of Neutral Responses)
Example of a Diffusion Index
As an example, for a sample survey question on whether the economy will enter into recession anytime soon, the results showed that 70 percent of respondents answered that there was a high likelihood, 20 percent answered that there was no likelihood, and 10 percent answered that there was a low likelihood.
If the results are inputted into the Fed’s formula for the diffusion index, it would be calculated as such:
[100 * (0.70 − 0.10)] / (0.70 + 0.20 + 0.10) = 60 / 1 = 60
If calculated using IHS Markit’s formula, the answer would be:
0.70 + (0.5 * 0.20) + (0.0 * 0.10) = 0.70 + 0.10 + 0.00 = 0.80
The results differ for either depending on the formula used. Assigning a baseline of 0 or 100 would be ideal in this example since the answer could be manipulated as double digits.
How to Interpret a Diffusion Index
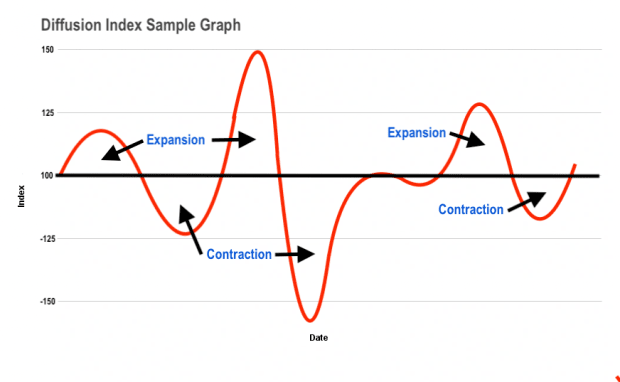
A series of data could show momentum and reveal whether there is are upward and downward trends. Data that are above the baseline would indicate expansion, while data below would indicate contraction. Data near or at the baseline would mean little or no change.
A sample graph below illustrates a data series showing expansion and contraction. The farther the data are from the baseline, the more the likelihood of either expansion or contraction there is over a given period.
What Are the Limitations of a Diffusion Index?
A diffusion index may represent a one-sided view. So, comparing the diffusion index to other datasets can provide additional confirmation or refute a conclusion made using a diffusion index. Using other metrics, such as the correlation coefficient, can show whether a diffusion index is a reliable prediction tool.