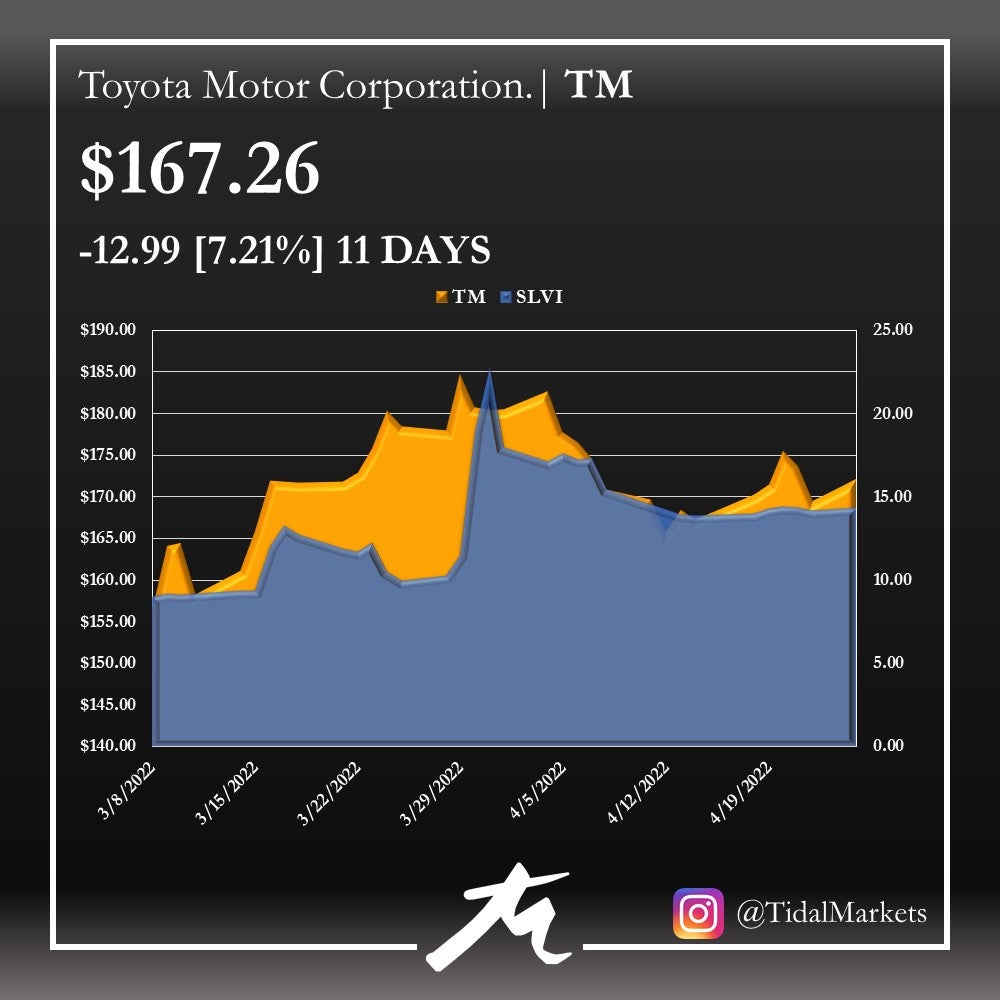
To showcase the securities lending volatility indicator (SLVI) as a stock market gauge, we show how changes in the SLVI forecasted a -7.21% decline in Toyota Motor Corporation (NYSE:TM) over 11 trading days in the early weeks of April 2022.
The securities lending volatility indicator is produced by Tidal Markets, in partnership with Benzinga Insights. Securities lending primarily serves the purpose of providing liquidity to short sellers. When unusual activity occurs in the securities lending markets, it acts as an upstream indicator of what is likely to occur downstream in the regular stock market.
Toyota Motor Corporation designs manufacture assembles and sells passenger vehicles, minivans and commercial vehicles, and related parts and accessories. It primarily operates in the Automotive Vehicle Financing industry segments.
Throughout the early weeks of March, TM saw its share price descend from highs of $181 per share down to $158 per share by mid-March, before slowing inching its way back up towards end of the month. With the calamity of the Russian Invasion of Ukraine rocking global markets, in particular the oil sector – undoubtedly the automotive and vehicle industries of the equity markets felt their fair share of volatility.
Halfway through March, SLVI values of TM were relatively subdued with volatility levels 27 bps below their 4Q21 average of 9.52 – albeit a slightly high indicator value, exemplifying signs of share price underperformance. Nonetheless, during the latter half of March TM volatility intensified, signifying another declination in price was on the horizon.
On the beginning day of our analysis, 3/8/2022, the SLVI reflected a volatility rate of 9.05 which was stable throughout the first half of March. But as we got deeper into the month, we saw the share price drive up precipitously, increasing over $14.32 per share or 8.63% within thirteen trading days. Just as we saw the share price of TM rise, we saw heightened activity in the SLVI indicator, doubling during the same period; whereby reaching an SLVI high of 22.83 by March 31st.

Between March 31st and April 14th, Toyota Motor Corporation lost -7.21%, or $12.99 per share, over an eleven day stretch. Meanwhile, the SLVI saw the volatility of TM both rally over 140% to levels over 22, before falling in volatility as the share price of TM quickly descended and plateaued off.
As we continue to watch SLVI values of TM into the end of April, we’ve seen volatility levels sustain itself at around 14, markedly higher than it’s 1Q22 values, and continuing to portray further weakness in its share price. Unless the SLVI of TM cools off back to early March levels, be on the lookout for likely further price declines.
TM is trading at $168.15 at the time of publication.


