Walmart (WMT) stock has been quietly trading higher. In fact, many defensive names like the retail giant have been on the mend.
Coca-Cola (KO) and PepsiCo (PEP) have been trading much better, as have names like Procter & Gamble (PG) and Johnson & Johnson (JNJ). Despite a minor post-earnings dip, J&J delivered strong earnings and guidance while raising its dividend.
Investors might wonder why they're seeing such strong trends in these names. Traders particularly might speculate whether we’re about to encounter a more difficult trading environment.
Don't Miss: Boeing Stock Faces Overhead Resistance as It Tries to Take Flight
In the case of Walmart stock, it’s going for its fifth weekly gain in the past six weeks. In that span, the shares are up more than 11%.
A number of retail stocks have been performing poorly, but some -- like Walmart -- have been on the mend.
Can Walmart continue its recent rally as it runs into resistance? Let’s look at the chart.
Trading Walmart Stock

Chart courtesy of TrendSpider.com
Walmart stock has rallied off the $136 level and the 200-day moving average. Recently, the shares pulled back to short-term support via the 10-day moving average and are trying to rotate higher.
Thus far, the 78.6% retracement and $151 level continue to act as resistance. On Wednesday the stock made new highs in the current rally but continues to struggle with this area.
In the short term, the bulls want to see a move over the $151 area and need to see the stock hold up above $148.
If the stock can clear $151, the door opens up to the recent high near $154.50.
If it breaks below $148, the next stop is $145 and the 21-day moving average.
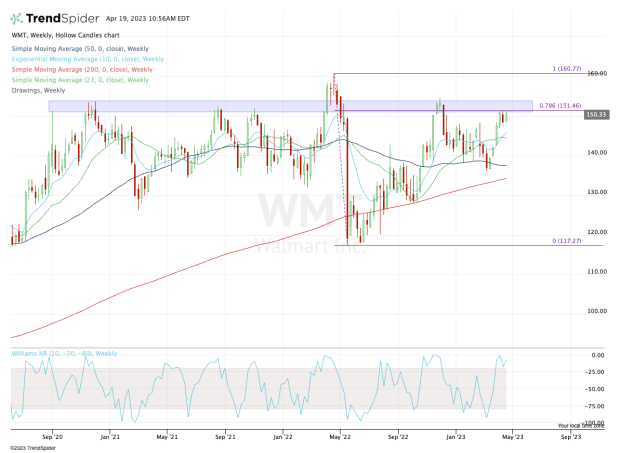
If we zoom out a bit and look at the weekly chart, traders can see why Walmart stock has been struggling a bit more lately.

Chart courtesy of TrendSpider.com
The low- to mid-$150s has been a troubling area for Walmart. When it did break out over this area in the first half of 2022, it quickly rocketed to $160, then rolled over and plummeted.
Don't Miss: Time to Buy Charles Schwab Stock? The Chart Acts as a Guide
In that respect, knowing -- and perhaps more important respecting -- some of these technical levels isparamount for traders.
For now, keep an eye on $151 on the upside and $148 on the downside.
Get investment guidance from trusted portfolio managers without the management fees. Sign up for Action Alerts PLUS now.


