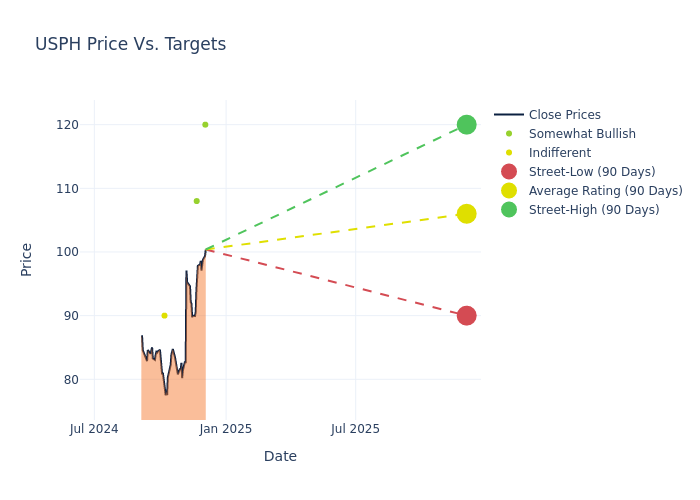
During the last three months, 6 analysts shared their evaluations of US Physical Therapy (NYSE:USPH), revealing diverse outlooks from bullish to bearish.
In the table below, you'll find a summary of their recent ratings, revealing the shifting sentiments over the past 30 days and comparing them to the previous months.
| Bullish | Somewhat Bullish | Indifferent | Somewhat Bearish | Bearish | |
|---|---|---|---|---|---|
| Total Ratings | 0 | 5 | 1 | 0 | 0 |
| Last 30D | 0 | 1 | 0 | 0 | 0 |
| 1M Ago | 0 | 2 | 0 | 0 | 0 |
| 2M Ago | 0 | 1 | 1 | 0 | 0 |
| 3M Ago | 0 | 1 | 0 | 0 | 0 |
Analysts' evaluations of 12-month price targets offer additional insights, showcasing an average target of $107.0, with a high estimate of $120.00 and a low estimate of $90.00. A 3.17% drop is evident in the current average compared to the previous average price target of $110.50.

Decoding Analyst Ratings: A Detailed Look
The perception of US Physical Therapy by financial experts is analyzed through recent analyst actions. The following summary presents key analysts, their recent evaluations, and adjustments to ratings and price targets.
| Analyst | Analyst Firm | Action Taken | Rating | Current Price Target | Prior Price Target |
|---|---|---|---|---|---|
| Calvin Sternick | JP Morgan | Raises | Overweight | $120.00 | $117.00 |
| Michael Petusky | Barrington Research | Maintains | Outperform | $108.00 | $108.00 |
| Michael Petusky | Barrington Research | Maintains | Outperform | $108.00 | $108.00 |
| Michael Petusky | Barrington Research | Maintains | Outperform | $108.00 | $108.00 |
| Joanna Gajuk | B of A Securities | Lowers | Neutral | $90.00 | $114.00 |
| Michael Petusky | Barrington Research | Maintains | Outperform | $108.00 | $108.00 |
Key Insights:
- Action Taken: Analysts respond to changes in market conditions and company performance, frequently updating their recommendations. Whether they 'Maintain', 'Raise' or 'Lower' their stance, it reflects their reaction to recent developments related to US Physical Therapy. This information offers a snapshot of how analysts perceive the current state of the company.
- Rating: Gaining insights, analysts provide qualitative assessments, ranging from 'Outperform' to 'Underperform'. These ratings reflect expectations for the relative performance of US Physical Therapy compared to the broader market.
- Price Targets: Analysts set price targets as an estimate of a stock's future value. Comparing the current and prior price targets provides insight into how analysts' expectations have changed over time. This information can be valuable for investors seeking to understand consensus views on the stock's potential future performance.
Capture valuable insights into US Physical Therapy's market standing by understanding these analyst evaluations alongside pertinent financial indicators. Stay informed and make strategic decisions with our Ratings Table.
Stay up to date on US Physical Therapy analyst ratings.
If you are interested in following small-cap stock news and performance you can start by tracking it here.
Discovering US Physical Therapy: A Closer Look
US Physical Therapy Inc through its subsidiaries operates outpatient physical therapy clinics that provide pre-and post-operative care and treatment for orthopedic-related disorders, sports-related injuries, preventative care, rehabilitation of injured workers, and neurological-related injuries. The principal sources of payment for the clinics' services are managed care programs, commercial health insurance, Medicare/Medicaid, workers' compensation insurance, and proceeds from personal injury cases. Its operating segment includes Physical therapy operations and Industrial injury prevention services. The company generates maximum revenue from the Physical therapy operations segment.
Unraveling the Financial Story of US Physical Therapy
Market Capitalization Analysis: Reflecting a smaller scale, the company's market capitalization is positioned below industry averages. This could be attributed to factors such as growth expectations or operational capacity.
Revenue Growth: US Physical Therapy's remarkable performance in 3 months is evident. As of 30 September, 2024, the company achieved an impressive revenue growth rate of 12.02%. This signifies a substantial increase in the company's top-line earnings. In comparison to its industry peers, the company stands out with a growth rate higher than the average among peers in the Health Care sector.
Net Margin: US Physical Therapy's net margin excels beyond industry benchmarks, reaching 3.46%. This signifies efficient cost management and strong financial health.
Return on Equity (ROE): US Physical Therapy's ROE stands out, surpassing industry averages. With an impressive ROE of 1.2%, the company demonstrates effective use of equity capital and strong financial performance.
Return on Assets (ROA): US Physical Therapy's ROA surpasses industry standards, highlighting the company's exceptional financial performance. With an impressive 0.57% ROA, the company effectively utilizes its assets for optimal returns.
Debt Management: US Physical Therapy's debt-to-equity ratio is below the industry average. With a ratio of 0.53, the company relies less on debt financing, maintaining a healthier balance between debt and equity, which can be viewed positively by investors.
Analyst Ratings: Simplified
Analyst ratings serve as essential indicators of stock performance, provided by experts in banking and financial systems. These specialists diligently analyze company financial statements, participate in conference calls, and engage with insiders to generate quarterly ratings for individual stocks.
Some analysts also offer predictions for helpful metrics such as earnings, revenue, and growth estimates to provide further guidance as to what to do with certain tickers. It is important to keep in mind that while stock and sector analysts are specialists, they are also human and can only forecast their beliefs to traders.
Which Stocks Are Analysts Recommending Now?
Benzinga Edge gives you instant access to all major analyst upgrades, downgrades, and price targets. Sort by accuracy, upside potential, and more. Click here to stay ahead of the market.
This article was generated by Benzinga's automated content engine and reviewed by an editor.


