
Mobile-phone stocks have been trading pretty well lately and are flying under the radar.
AT&T (T), Verizon (VZ) and T-Mobile (TMUS) are all up about 7.5% over the past month, as buyers slowly accumulate the stocks.
Part of that may be dividend-related, as AT&T and Verizon yield 5.6% and 6.6%, respectively. But that doesn’t explain the rally in T-Mobile, which doesn’t pay a dividend.
Did it just come along for the ride? The “why” doesn’t matter as much as the “what.”
Put another way, what matters right now is that the stocks are trading better and the price action has been decent. The question now is: Can they continue?
Trading AT&T Stock
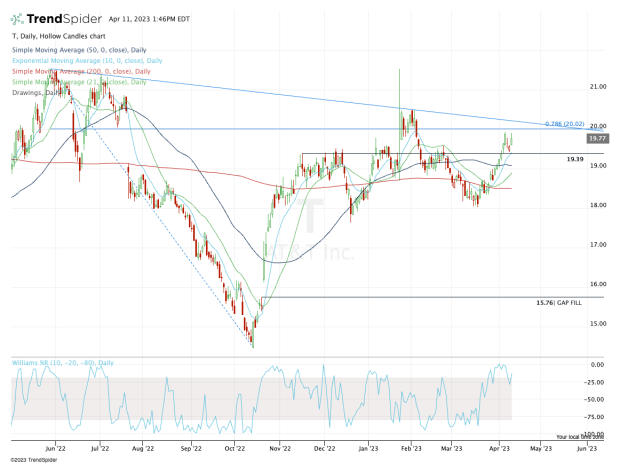
Chart courtesy of TrendSpider.com
A few months ago, AT&T stock tried to break out over downtrend resistance (blue line) and failed. After a steady uptrend followed by a quick pullback to the $19.50 level and the rising 10-day moving average, the bulls are once again gobbling this one.
Don't Miss: Here's How Netflix Stock Can Rejoin the Nasdaq Party
A move above $20 would set the stage for another test of downtrend resistance. If AT&T can push through this measure, it puts the 2023 high in play at $21.53, followed by a potentially larger upside move.
On the downside, this trade loses most of its momentum if it breaks below $19.50. If that’s the case, AT&T needs to hold the 21-day and 50-day moving average near $19.
Trading Verizon Stock
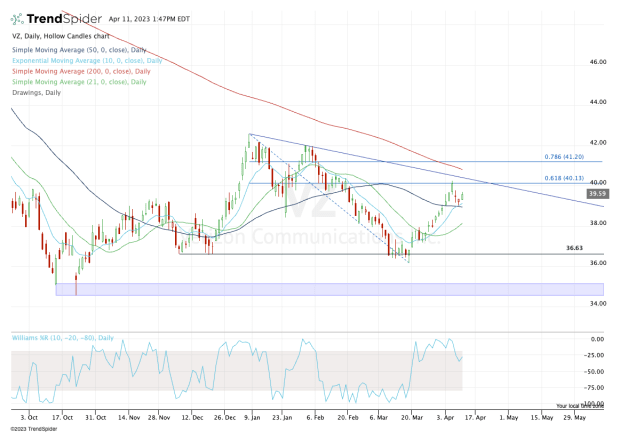
Chart courtesy of TrendSpider.com
Verizon stock saw a strong rally, climbing in 12 out of 14 sessions. It ran into the 61.8% retracement, which helped trigger some profit-taking and a quick pullback.
Now it's finding support and the 10-day and 21-day moving averages. Let’s see if Verizon stock can push back up toward $40.
Don't Miss: Cathie Wood's ARKK: Traders Mull Breakout or Breakdown
Ultimately, a move over $41.25 is what the bulls are fishing for. Above that level would put Verizon above the recent high, the 78.6% retracement, the 200-day moving average and downtrend resistance (blue line).
On the downside, a close below $39 could usher in more selling pressure.
Trading T-Mobile Stock
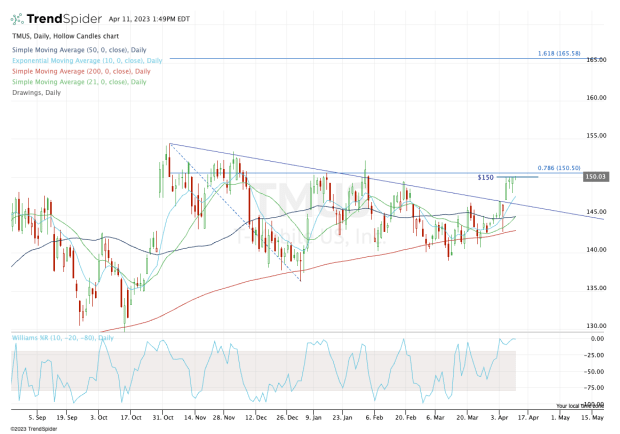
Chart courtesy of TrendSpider.com
In regard Verizon and AT&T, note how both stocks are still trading below downtrend resistance. For T-Mobile stock, the shares have already cleared this level and are working on a fourth straight day of gains.
Now the stock is struggling with $150, the obvious breakout point for the bulls to keep an eye on. Above $150.50 could set the stage for a run at the 2023 high at $154.38 -- and potentially higher.
On the downside, the bulls want to see this stock continue riding its 10-day moving average higher. In the short term, holding above the $146 level is vital to keeping momentum on the bulls’ side.