/Microsoft%20France%20headquarters%20by%20JeanLuclchard%20via%20Shutterstock.jpg)
Microsoft (MSFT) shares are down an outsized 14% in 2026.
For patient and longer-term MSFT stock investors, that means now is the time to get in the game with a protective, bullish collar spread.
Microsoft 365. Windows OS. Microsoft Copilot. Azure. Xbox, or even Solitaire. From allowing individuals and companies to be more productive, and at other times, less so, diversified tech giant Microsoft is everywhere.
Yet despite the company’s importance in our digital lives, as an investment, MSFT stock has looked less influential over the past several months.
Shares of MSFT stock have declined as much as 31% from last July’s all-time-high. That’s more than double this year’s price drop.
What’s behind the relative and absolute price weakness of Microsoft’s bear market cycle?
In recent weeks, pressure has been directed at hefty capital expenditures tied to Microsoft’s artificial intelligence (AI) data centers and forecasts of continued spend that could reach $200 billion in fiscal 2027.
Bears have also enjoyed control over MSFT stock as a “SaaS Apocalypse” has gripped Wall Street.
The threat of AI agents making tech companies with software subscription business models obsolete lopped more than $1 trillion off the subsector during the height of February’s panic.
About Microsoft Shares Today
It’s not all bad news for MSFT stock, though, if investors can look past the headline scares.
The fact is today’s threatening narratives have allowed shares to trade at levels that historically are deep in value territory when reviewing popular financial metrics.
The following include just a few of the many heavily discounted ratios found in today’s MSFT stock:
- Price-to-Sales (P/S) ratio of 9.15 trades 17% below Microsoft’s 5-year 11.07 P/S multiple
- P/E GAAP at 23.49 sits 25.60% below the 5-year average of 31.58
- Forward Price-to-Cash Flow of 18.35 trades -23.45% a 5-year 23.98 multiple
- A 1.69 PEG ratio of 1.69 is priced 28.56% below the 5-year average of 2.37
And let’s not forget, Microsoft remains a large-cap growth story as Barchart’s Sushree Mohanty recently noted.
MSFT Stock Technical Picture
As strong as the discounting appears, the price chart supports an equally compelling value opportunity for bullish longer-term investors.
First, there’s MSFT stock’s larger 31% correction. While punishing, the stiff price decline is also well-aligned with where growth stocks commonly find meaningful bear market cycle bottoms.
Microsoft has a couple other technical supports to bullishly lean on when considering a share purchase right now.
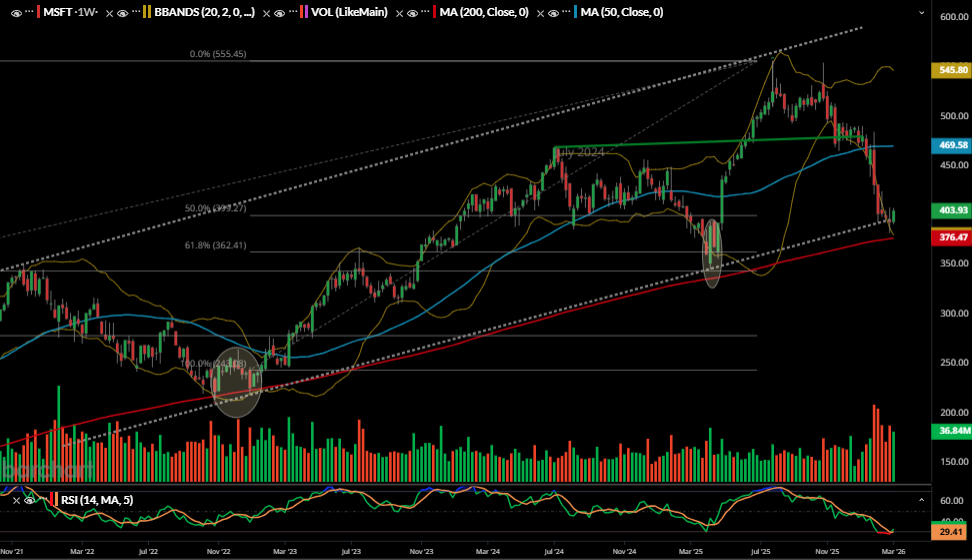
The extended weekly chart highlights past bear market lows that have occurred the past few years.
Opportunistically, the end of those cycles coincided with tests of Microsoft’s 200-week moving average. And that’s where MSFT stock is today for all intents and purposes.
Powerfully and without question, MSFT stock has, for the first time in nearly 20 years, triggered an oversold weekly RSI reading and signaled a bullish crossover.
And in conjunction with Microsoft’s weekly chart Bollinger Band reversal pattern, value conditions for bullish investors are easy to appreciate.
Affordable MSFT Stock Protection
While the value offered by MSFT stock’s financial and price chart positioning should resonate with investors, option prices aren’t a screaming buy.
Also, Microsoft’s calls and puts aren’t so rich that an outright short or sale of premium makes sense either.
The pricing is a bit of a mixed bag.
Looking at Barchart’s new Options Data Dashboard page, the IV/HV statistic is at 0.71. This means option prices are trading at a 29% (1.00 - -.71 = 0.29) discount to Microsoft’s historical price swings.
That’s good for buyers. But there’s more information to look at.
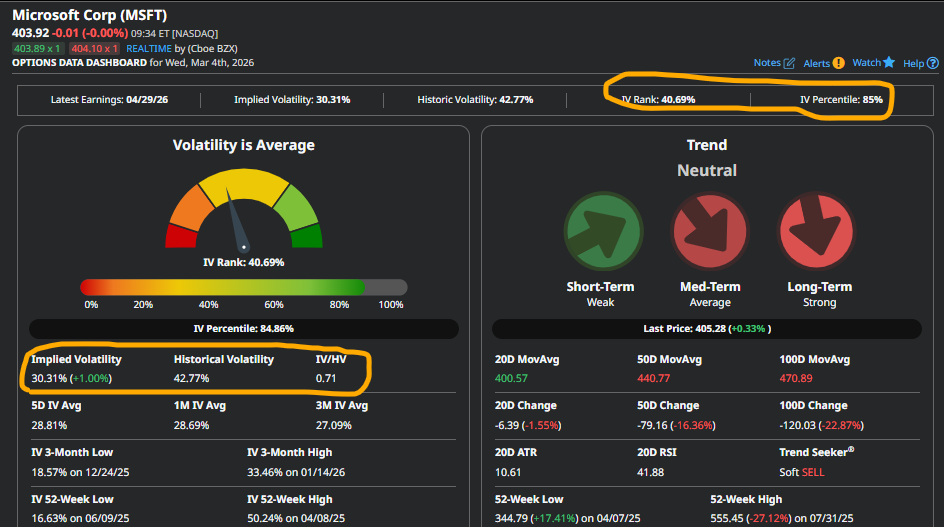
More challenging for both gunslinging long and short premium investors are the mixed IV Rank and IV Percentile readings.
At 85%, the latter measure means that over the past 52 weeks, Microsoft stock’s implieds have only been higher 15% (1.0 - 0.15 = 0.85) of the time. That appears to favor premium sellers.
Then there’s the rank statistic. Today’s levels indicate MSFT’s implieds are roughly 41% above the low of the trading range for the past year. That’s slightly better for premium buyers, but mostly a neutral reading.
Given the muddled options pricing, one stock strategy that makes sense is a protected collar spread.
A collar allows bullish investors to reduce some of the pitfalls associated with just buying or selling options as a protective long put to hedge shares is financed by the sale of a call.
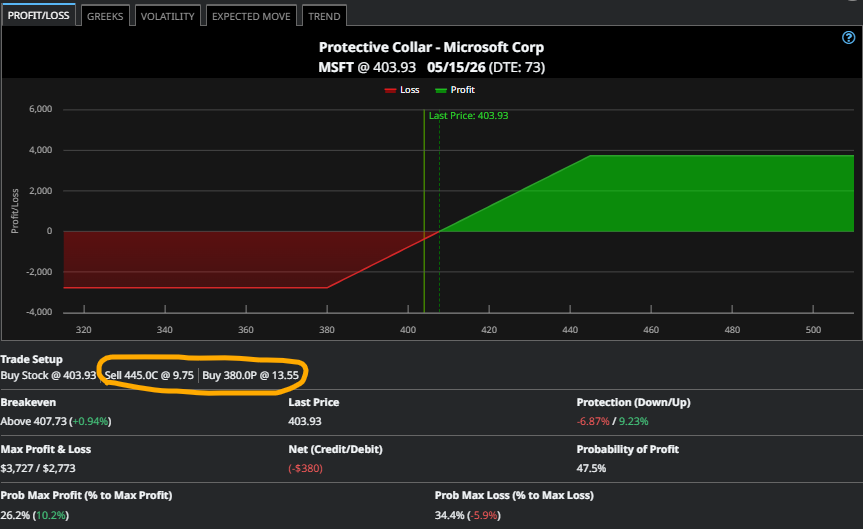
And as the illustrated May $380 - $445 collar reveals, the sold call reduces the cost of the put by more than a bit of chump change.
To be exact, the sale of the out-of-the-money call knocks 72% ($9.75 / $13.55) off the spread’s downside insurance policy.
As those familiar with bull call spreads can see, the initial risk-to-reward profile looks the same as the limited risk vertical. And it should.
Synthetically, a collar’s long put and stock at a 1:1 ratio is the risk equivalent of a purchased same strike call.
And a higher up call, as with the vertical, is sold to help reduce the cost of the lower protective strike.
You can learn more about the collar strategy here.
The Bottom Line
Getting long Microsoft stock at an attractive discount has rarely looked better in recent years.
Still, and given a collar’s decent profit prospects when things do go as planned, the strategy makes for a pretty decent long-term partnership versus a standalone long stock position.
And in a world where history isn’t obligated to repeat itself and the price for MSFT stock protection is questionable, the collar strategy is a trader’s best-looking friend with benefits.