/Semiconductor%20by%20Gorodenkoff%20via%20Shutterstock.jpg)
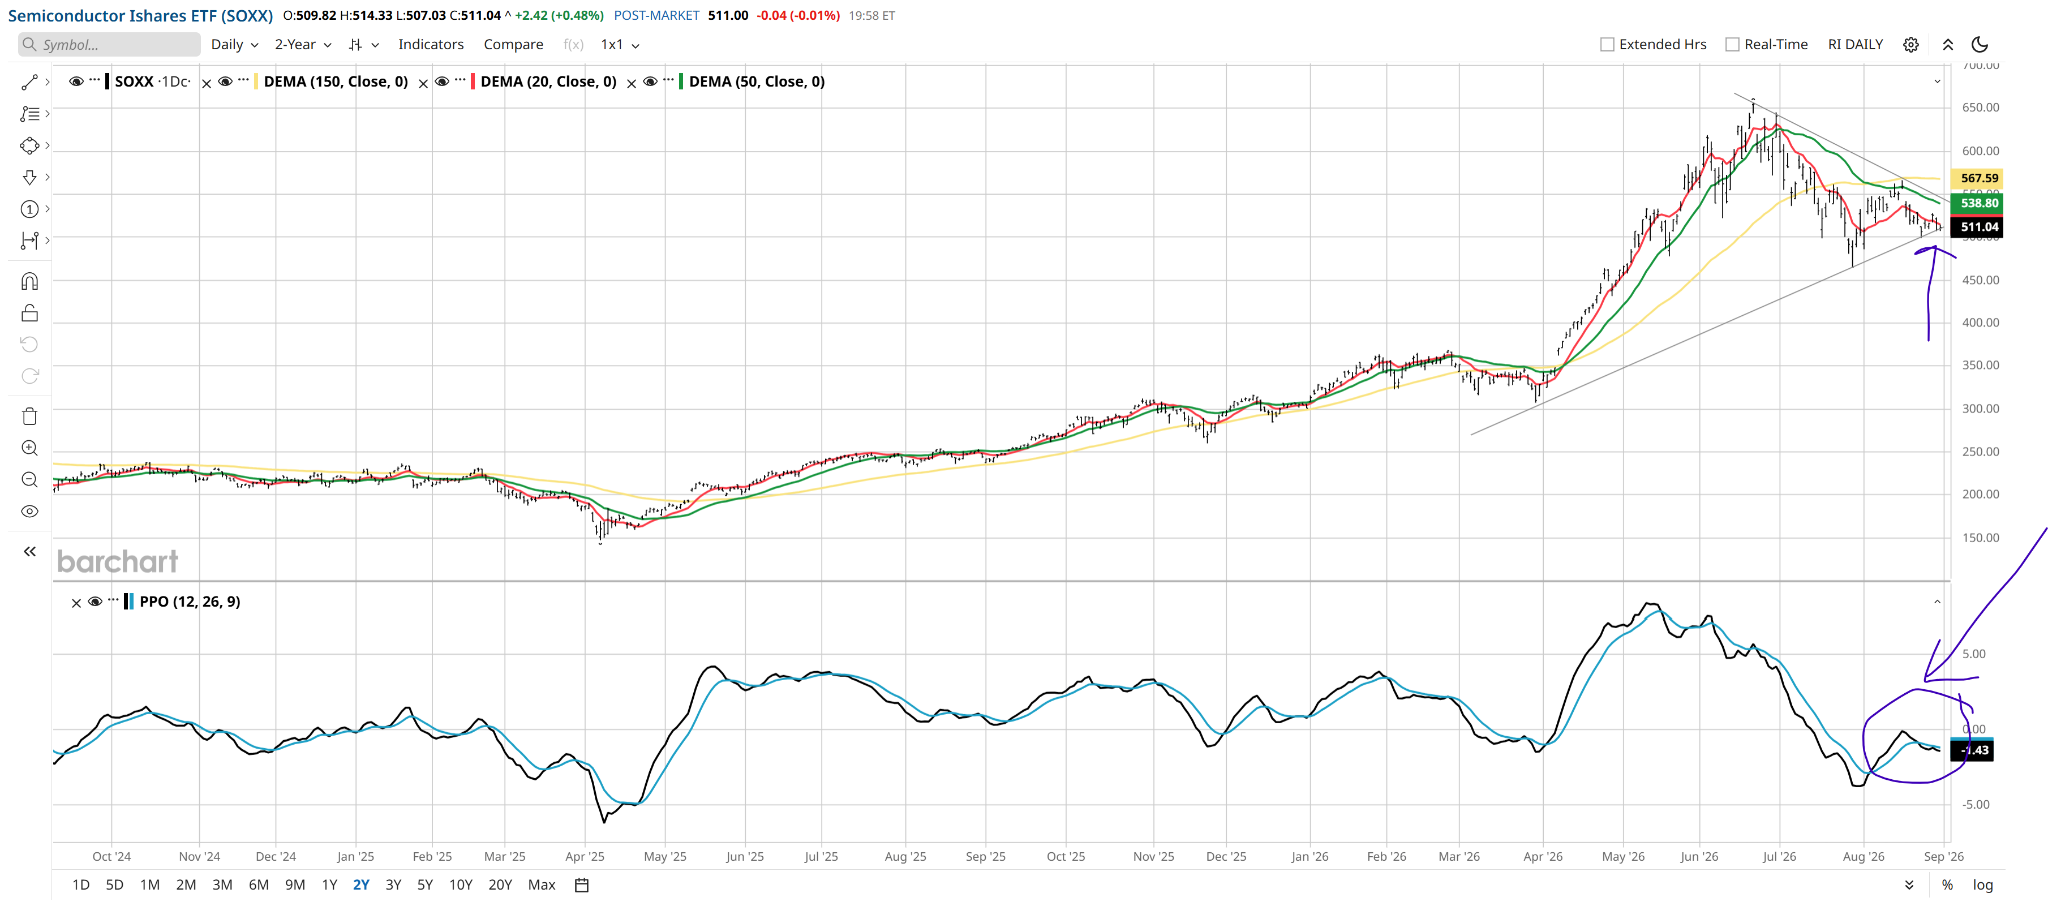
I have a chart that will knock your socks off. It’s none other than the very popular iShares Semiconductor ETF (SOXX), and I’ve marked in purple a very important point in the long up cycle. That’s a triangle, or wedge. And if SOXX breaks down through it without an instant recovery, it could open the stock market floodgates.