The Task Manager app has long been one of the most essential tools in the operating system, offering a glimpse into the inner workings of your computer. On Windows 11, the tool has been reimagined with a modern design and new enhancements that make managing your computer a little easier.
However, even though you may already be familiar with Task Manager, the tool includes many useful features you have probably overlooked that can help you have better control of your system, such as Efficiency Mode, memory dump, drive monitoring, network details, firmware boot time information, wait chain analyzer, desktop widgets, always on top, and more.
In this how-to guide, I will share with you a collection of lesser-known tips to help you get even more from the Task Manager on Windows 11.
Collection of tips to make you more productive on Task Manager
Task Manager has undergone several enhancements, and it includes features that even advanced users may overlook. Here are some secrets and lesser-known tips:
1. Quick shortcut
Although you can open Task Manager from the Taskbar context menu, you can always use the "Ctrl + Shift + Esc" keyboard shortcut for even quicker access.
If you want to launch the tool from the Run command or Command Prompt, you can use the taskmgr command.
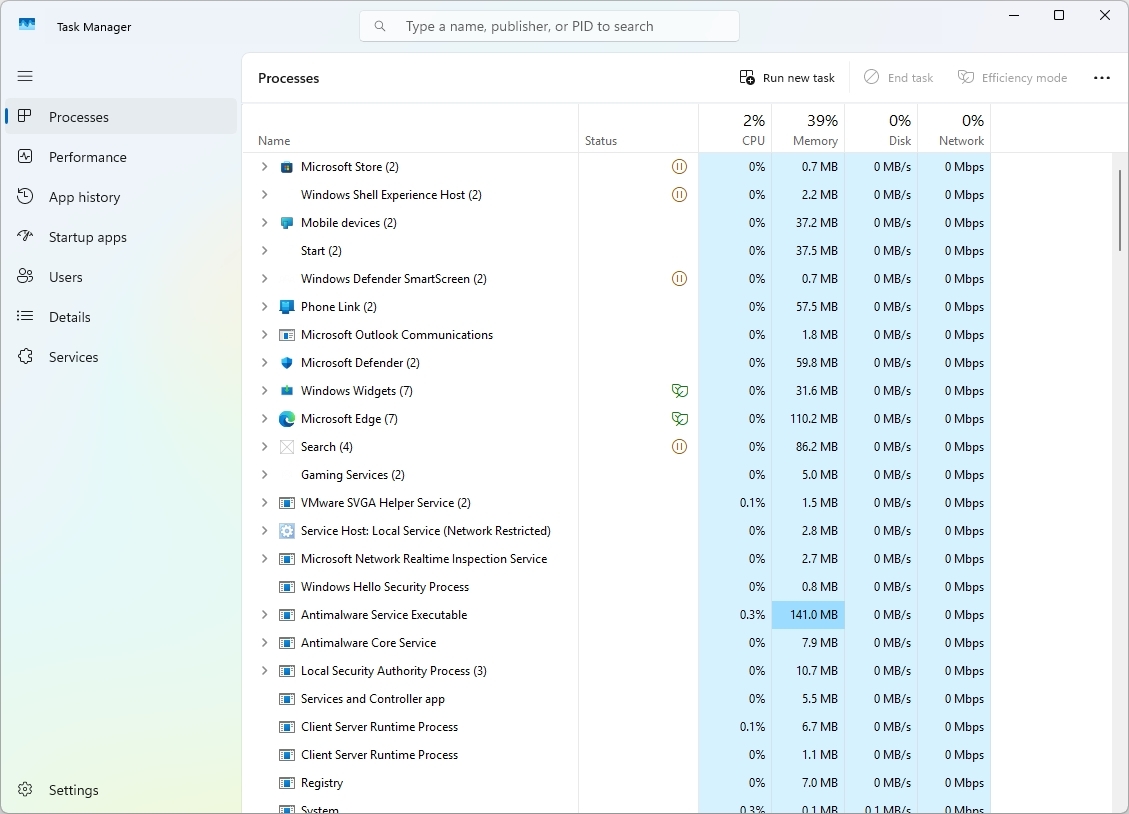
2. Efficiency mode
In Task Manager, Efficiency Mode is a feature designed to optimize system performance and energy efficiency by prioritizing foreground applications and reducing the resource consumption of background processes.
When you enable Efficiency Mode for a specific process, the system will lower its priority. In other words, the system will allocate fewer resources to that process, allowing more resources to be dedicated to the applications you're actively using. This will also help conserve system resources like processor and memory, leading to improved performance and battery life, especially on devices with limited resources.
To enable Efficiency Mode for a process in Task Manager, click on the "Processes" tab, then right-click the process, choose the "Efficiency Mode" option, and click the "OK" button.
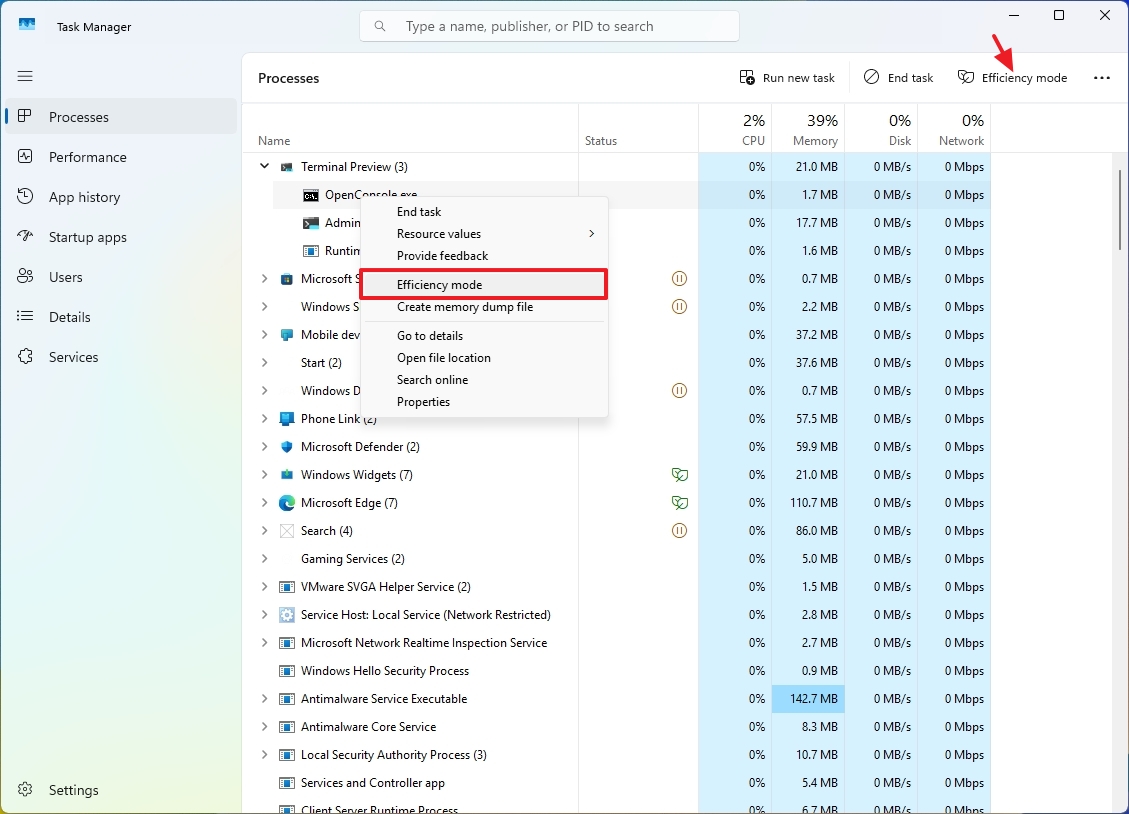
The feature is only available for specific applications. If the option isn't available, it's not supported for that particular item.
I only recommend using this feature if you know what you're doing because lowering the process priority of an application can affect system stability.
If you want to undo the changes, right-click the process and choose the "Efficiency Mode" option again to clear the checkmark.
3. Show command line
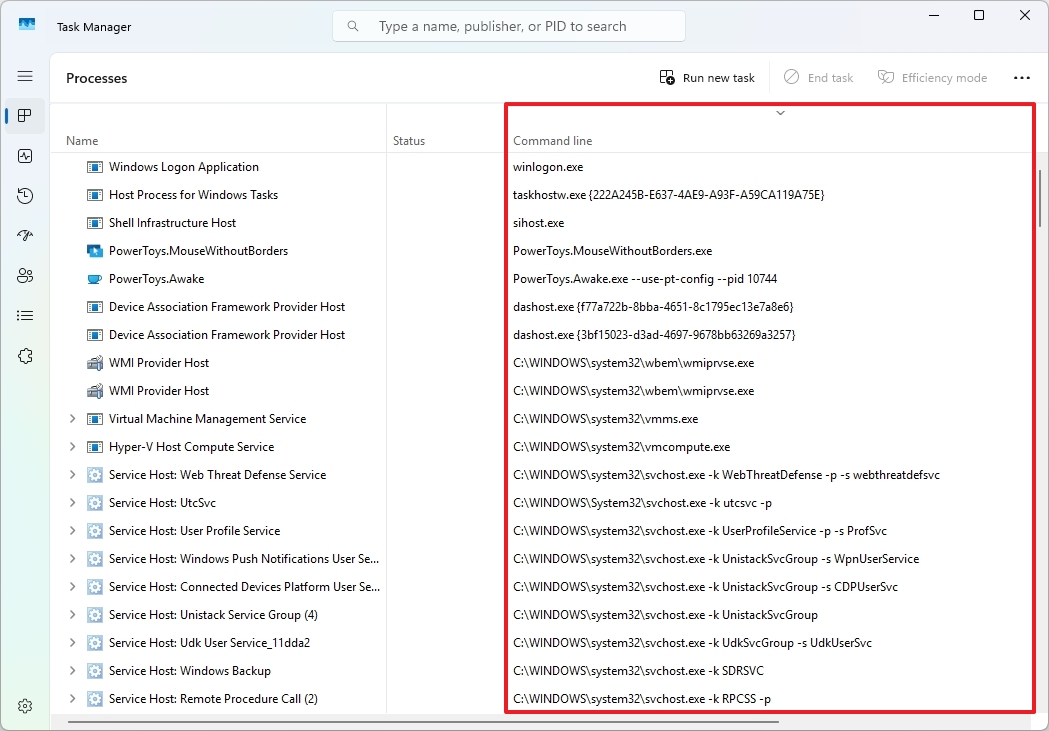
The "Processes" tab can also show the specific command line that was used to launch a particular process, which can come in handy when troubleshooting problems.
To show the command line for each process, click on the "Processes" tab, right-click the header of the column, and choose the "Command line" option.
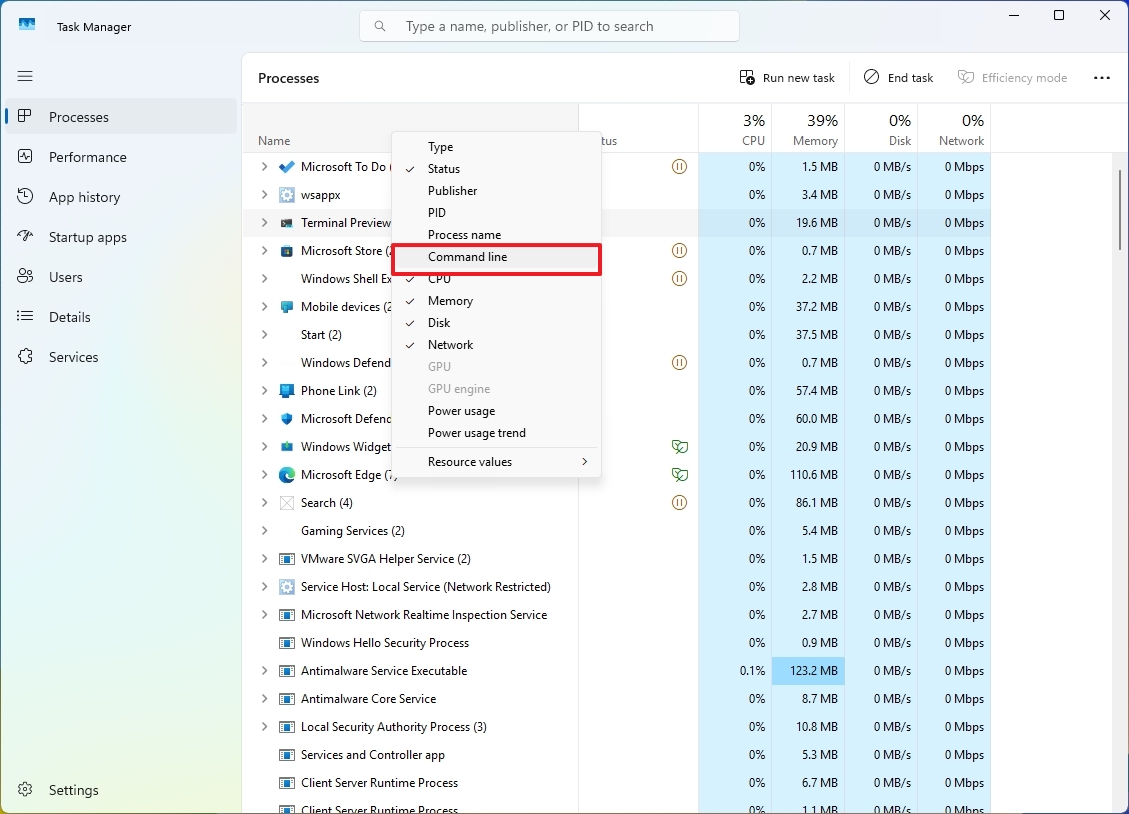
After turning on the option, you will see a new "Command line" column with the command that was used to run the process.
4. Create memory dump
On Windows 11, a memory dump is a snapshot of a system memory at a specific moment. It can be a valuable tool for troubleshooting crashes, errors with apps, or general performance issues. Task Manager allows you to create memory dumps for specific processes, which can be helpful for diagnosing software problems.
To create a memory dump using Task Manager, click the "Processes" tab, right-click the process in question, and select the "Create memory dump file" option.
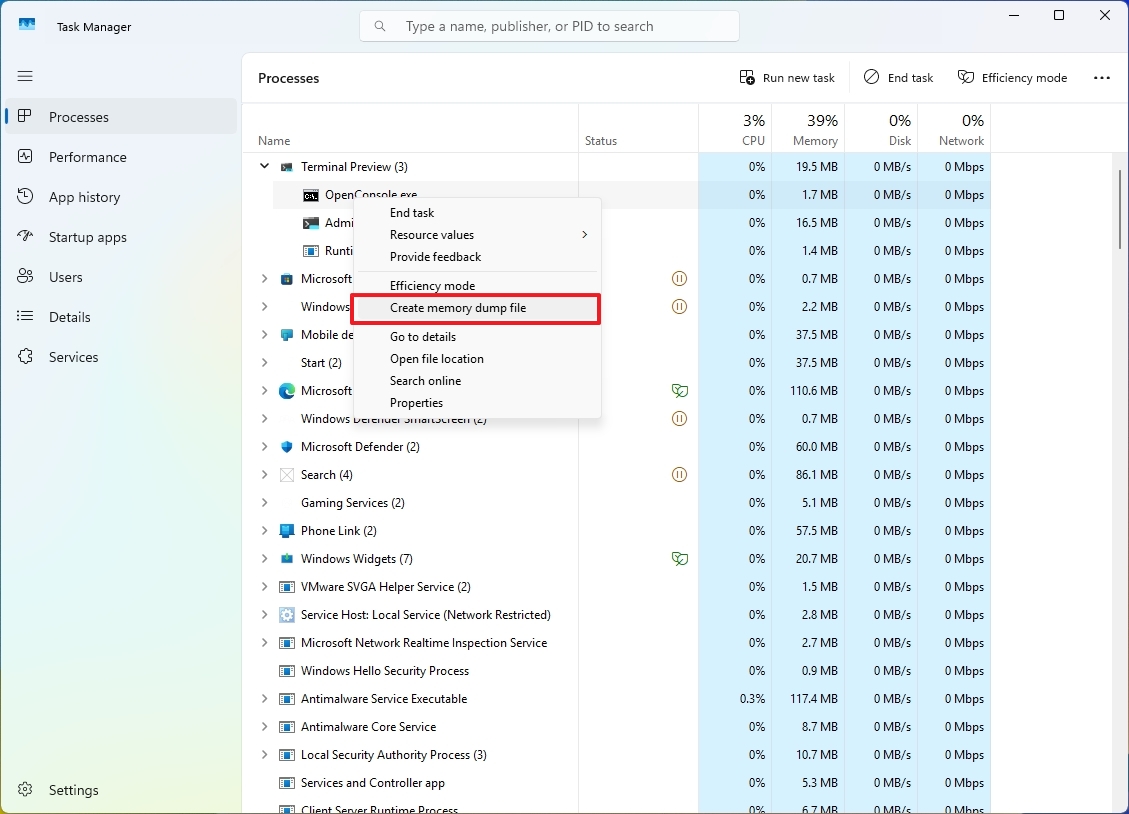
Once the dump file is created, Task Manager will show you the location of the ".dmp" file, which you can copy to the clipboard or click the "Open file location" button.
Although this is a powerful tool, analyzing a memory dump often requires specialized tools and knowledge.
5. Show every core in the processor
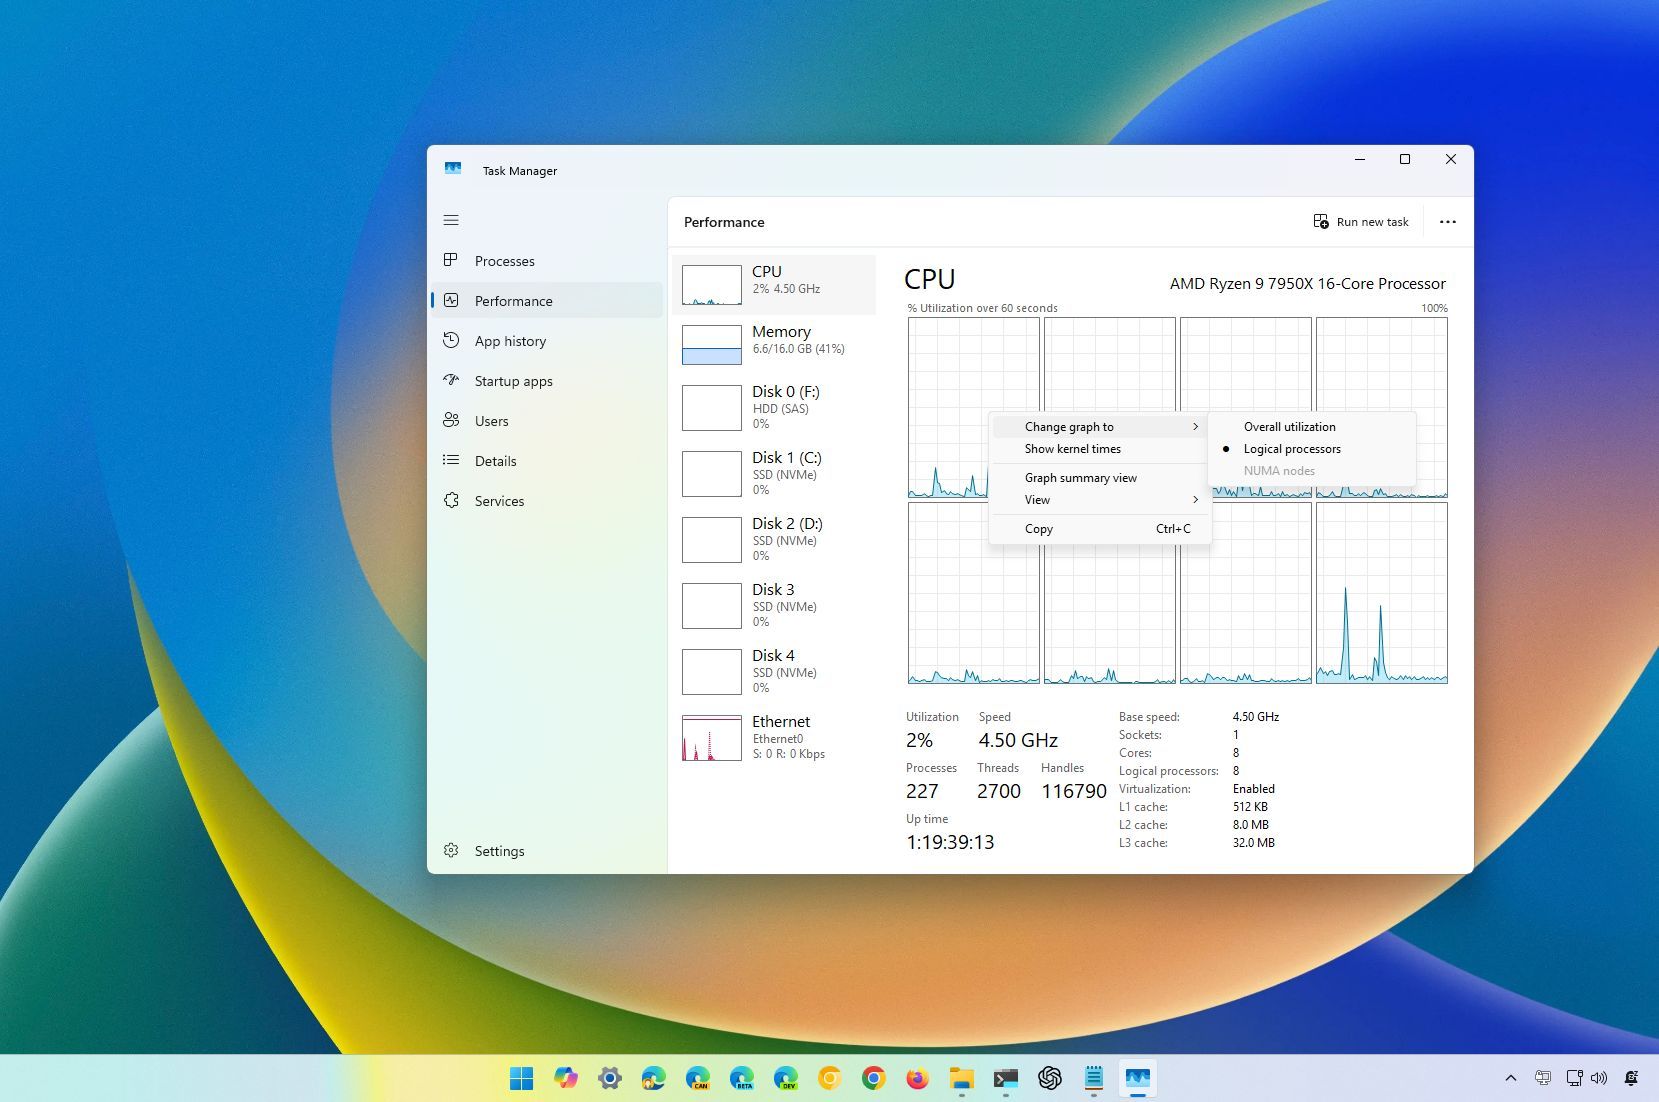
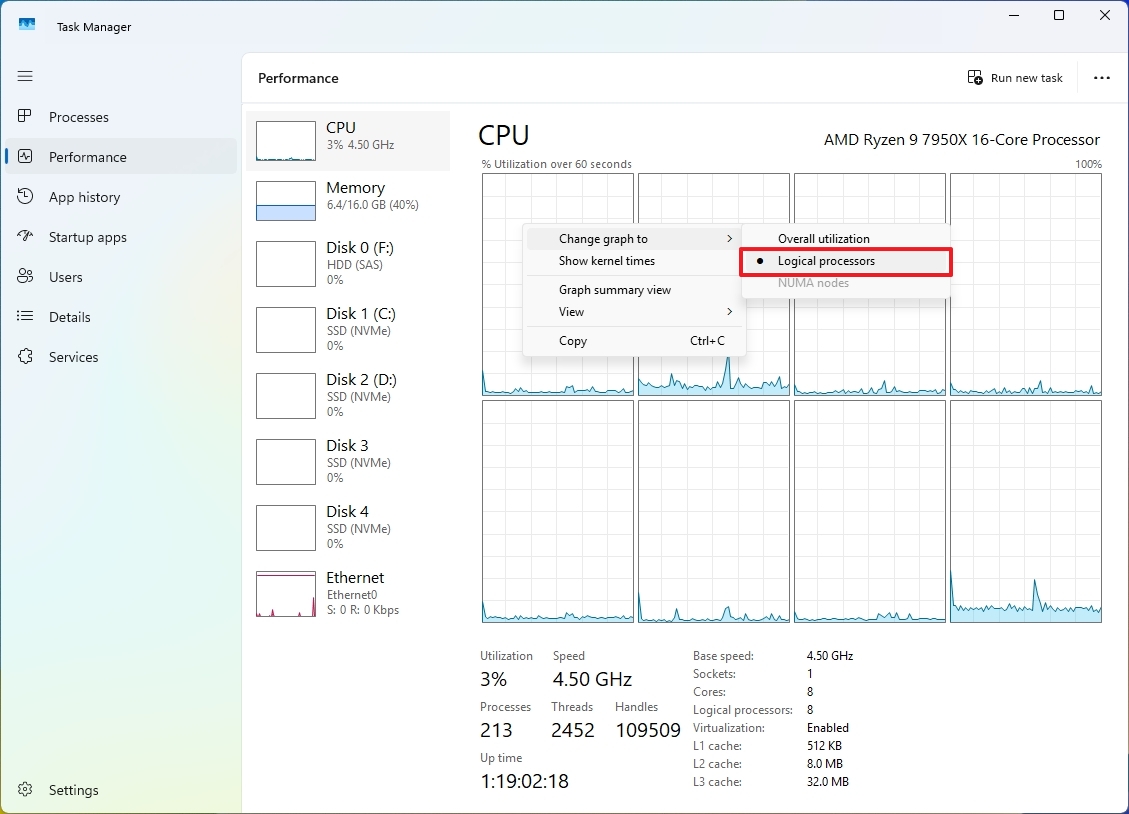
In the "Performance" tab, when viewing the "CPU" information, you will probably have the "Overall utilization" view that shows the activity that corresponds to the entire processor as one entity. However, you can also change the view of the active time of each core.
If you want to see the performance activity of each core inside the processor, right-click on the CPU graph in the "Performance" tab, select the "Change graph to" menu, and choose the "Logical processors" option.
6. Check graphics temperature
In the "Performance" tap, you can also find the temperature of the graphics card, which can come in handy for those who are troubleshooting a gaming PC or thermal issues while using rendering software like photo and video editing solutions.
To check the GPU temperature, you only have to open the "GPU" tab and then locate the temperature reading under the tab title or on the page.
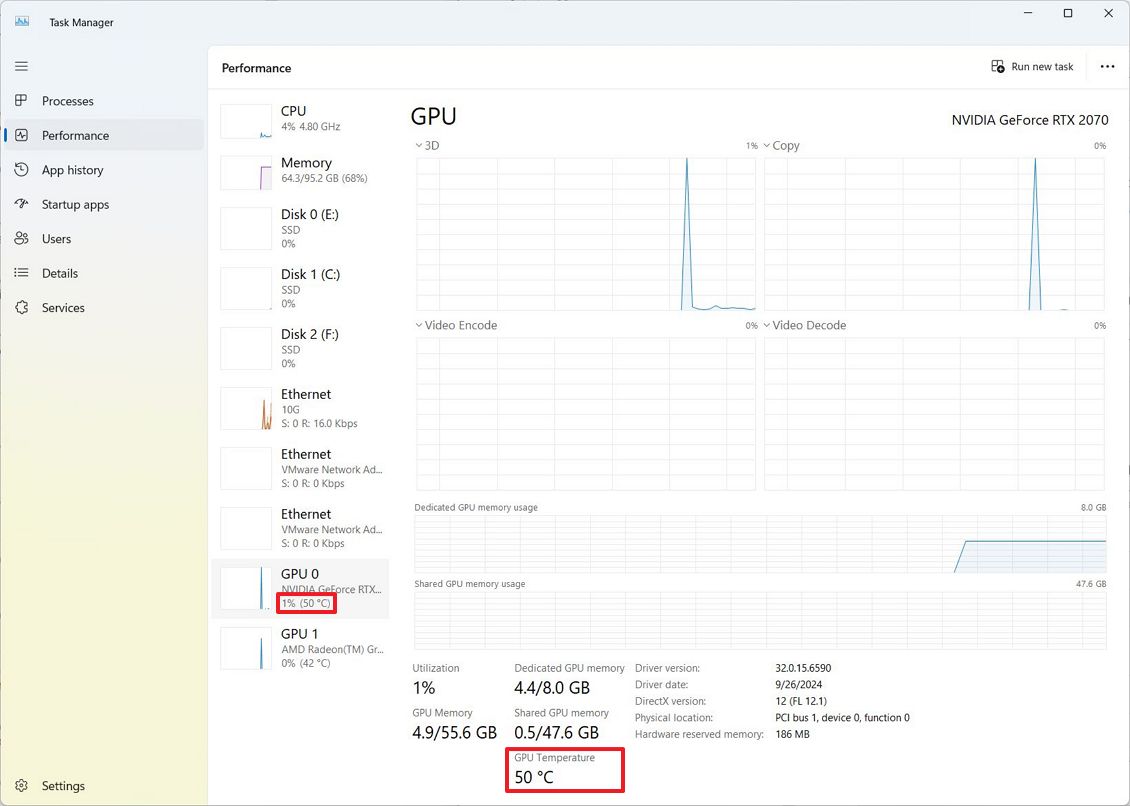
This information may not be available on every graphics card, which is a typical case on older or virtualized graphics cards.
Usually, a temperature range of 65 to 85C is normal, but anything over 100C constantly should be considered overheating.
7. Check drive media type
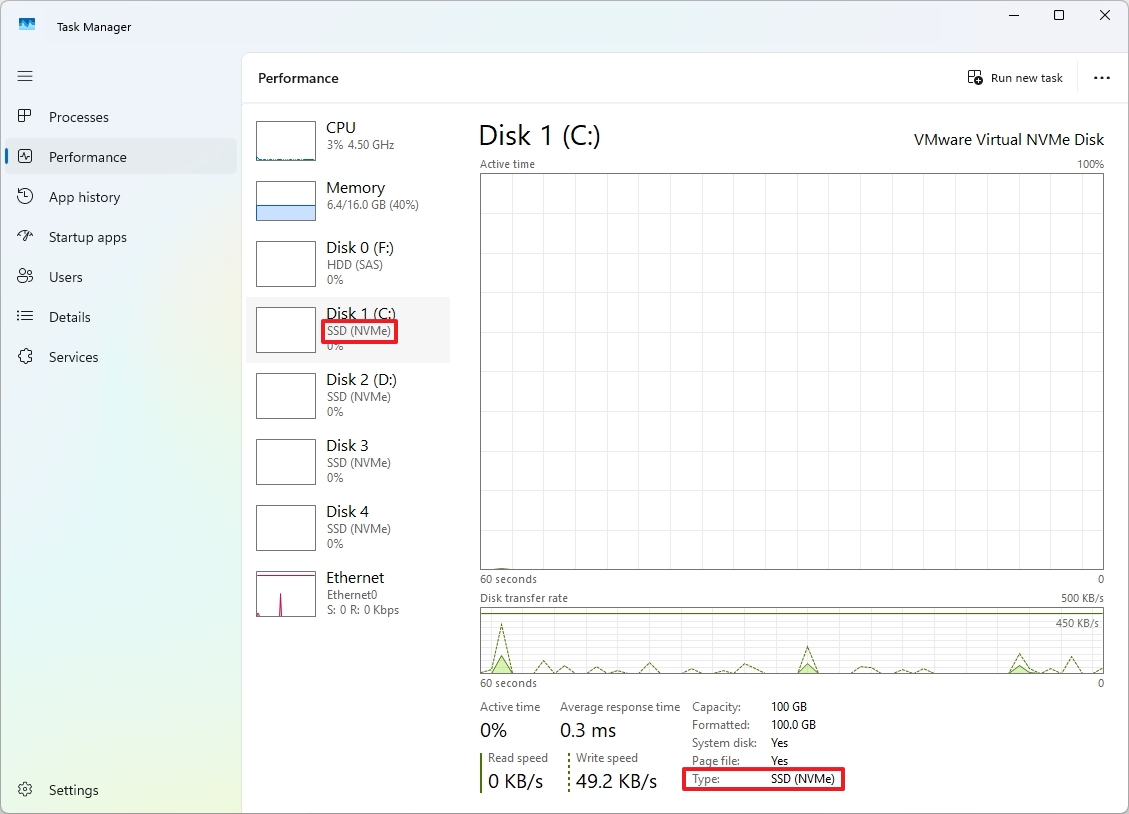
Although there are multiple ways to check the type of storage connected to your device, the Task Manager can now tell you if the drive is SATA, NVMe, etc.
To check the type of drive installed on your computer, open the "Performance." tab and click on the drive. The label with the type information will be displayed under the tab title and on the page in the "Type" field.
8. Show network details
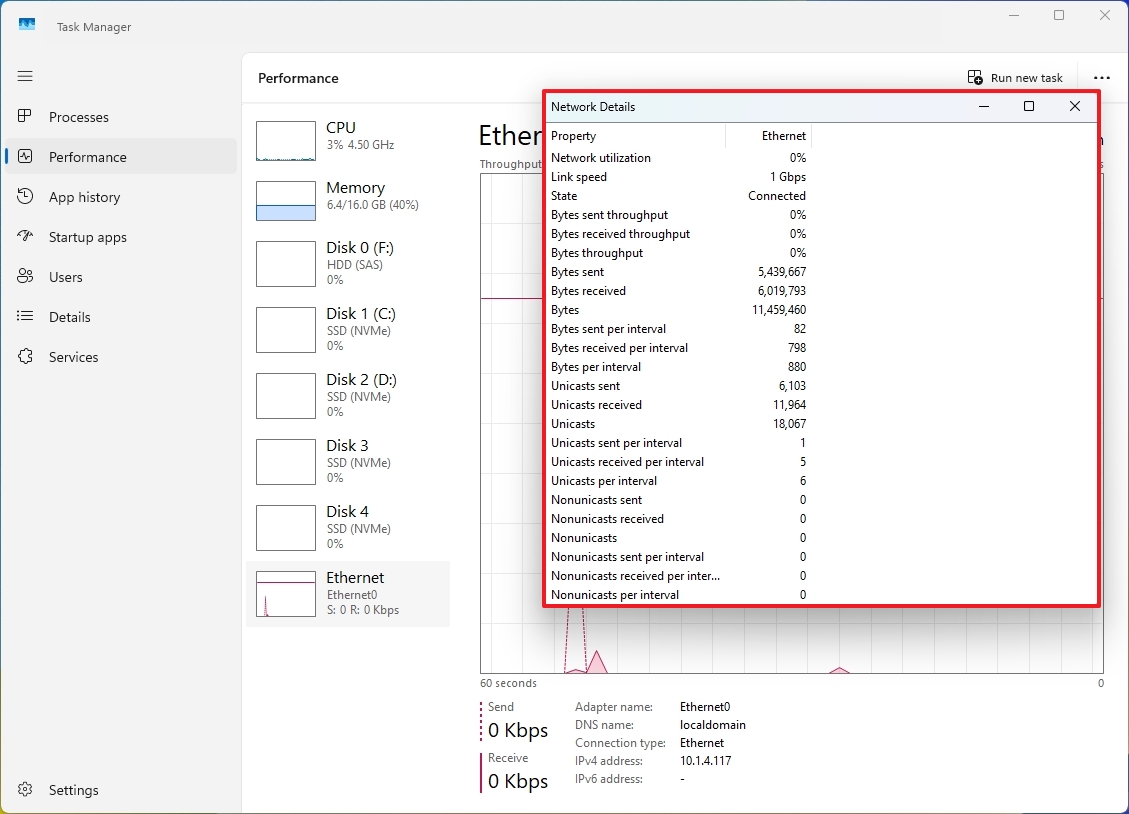
When viewing the network adapter activity in the "Performance" tab, you will only find information about the throughput for sent and received packets, but you probably didn't know that you can also view other network details, such as network utilization, state, different types of information for sent and received bytes and unicast packets that can be useful when troubleshooting issues or monitoring the network connection.
To view more details about a specific network adapter, in the "Performance" tab, click on the Ethernet or Wi-Fi adapter, right-click the graph, and choose the "View network details" option.
9. Disable startup apps
Although you can manage which apps should load at startup, you can also use the Task Manager to determine and disable virtually any app from loading automatically as the computer starts.
To control apps at startup from the Task Manager app, click the "Startup apps" tab, click the "Startup impact" column header to sort the apps by how they impact the system performance, select an app, and click the "Disable" button.
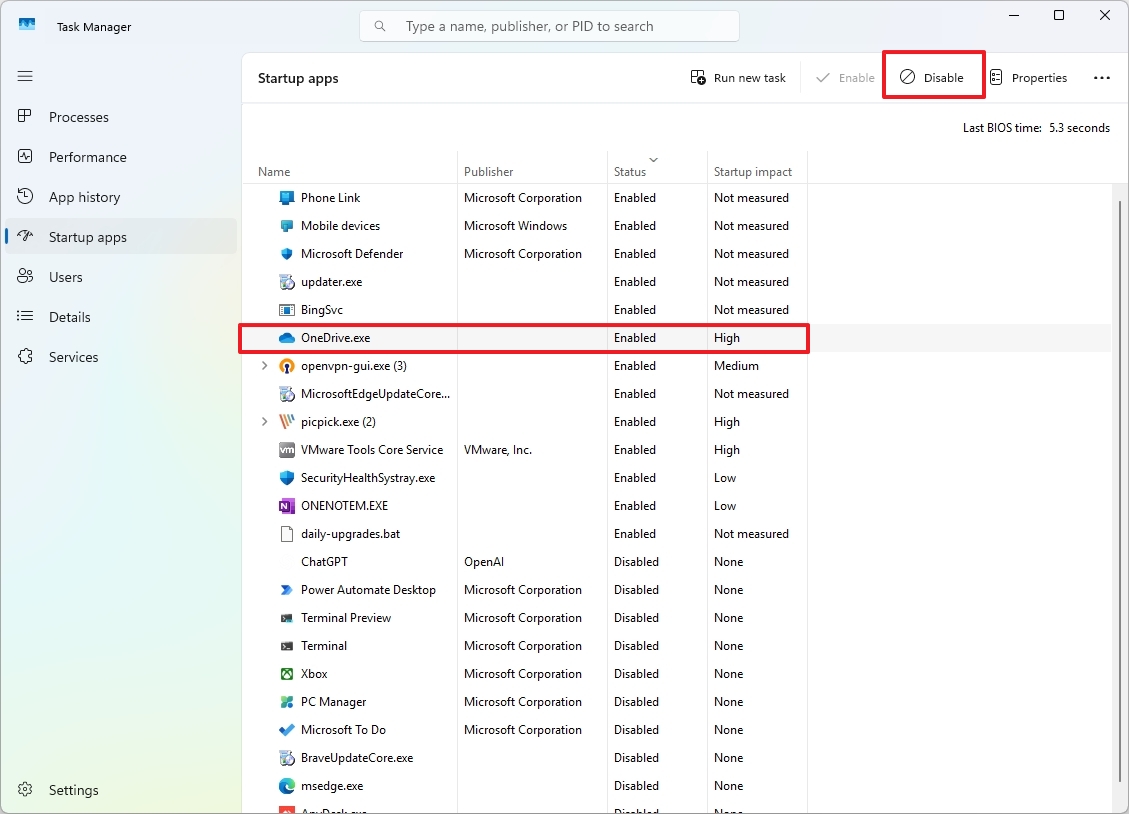
You can also select an app and click the "Enable" button to allow the app to run a startup.
10. Check boot speed time
In the "Startup apps" tab, you can also check the time for the last boot of the Basic Input/Output System (BIOS). The information appears at the top right of the page.
The "Last BIOS Time" displayed represents the amount of time it took for your computer's BIOS (or Unified Extensible Firmware Interface (UEFI)) to initialize your hardware and run the Power-On Self-Test (POST) before handing control to the operating system.
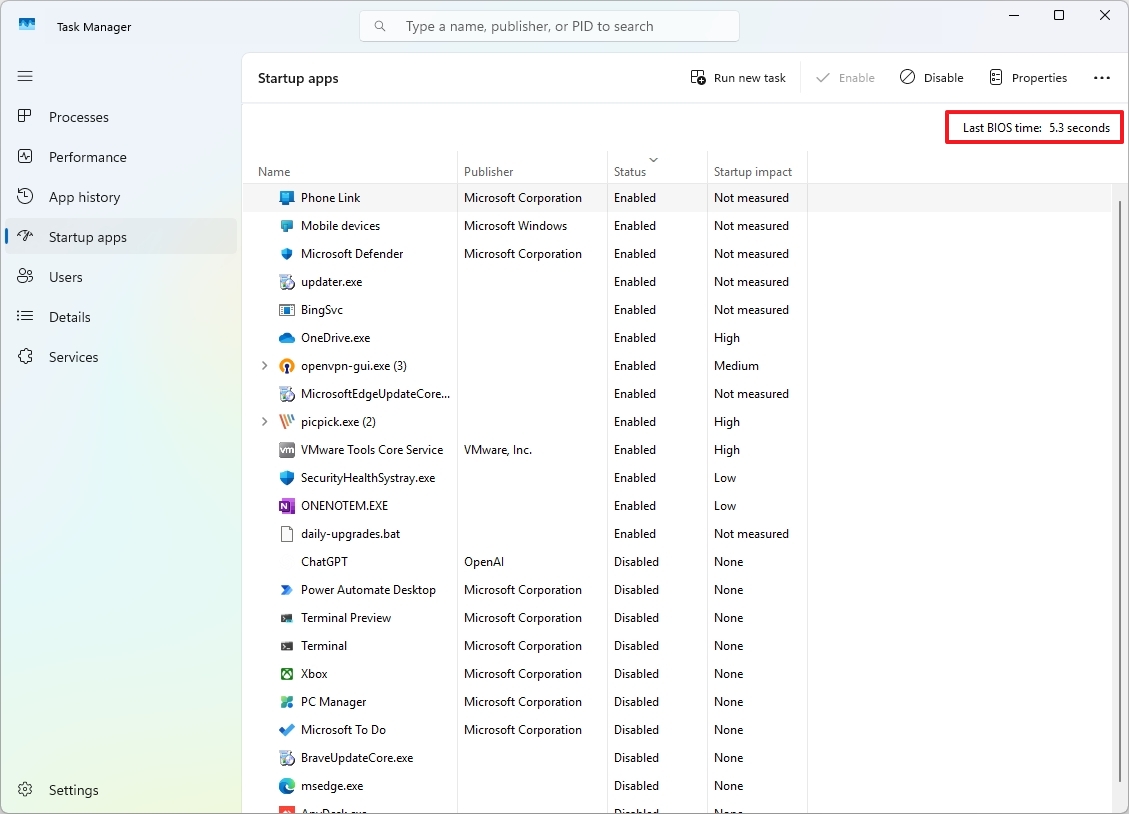
This information can always come in handy when troubleshooting slow boot times, comparing boot times with different devices, benchmarking, and trying to understand the system's health.
11. Real-time drive monitoring
The "Details" tab provides a comprehensive view of the system's running processes. It offers granular information about each process, making it easier to identify resource-intensive tasks, troubleshoot performance issues, and optimize your system.
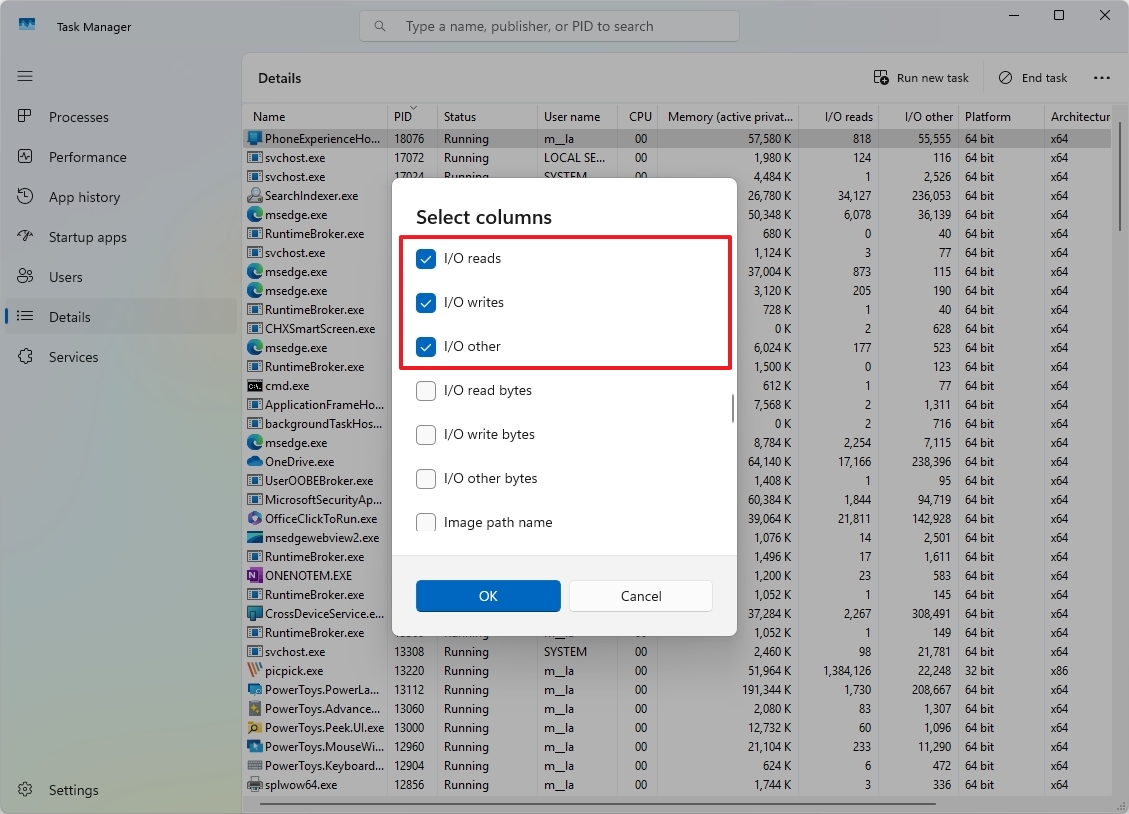
However, you can also edit the view to show "I/O Reads," "I/O Writes," and "I/O Other," which are metrics that provide insights into how a process interacts with your system's storage devices, making these options useful to troubleshoot drive issues, such as on those time when the hard drive is showing 100 percent utilization.
To show I/O information in Task Manager, open the "Details" tab, right-click any of the column's header, choose the "Select columns" option, check the "I/O Reads," "I/O Writes," and "I/O Other" options, and click the OK button.
12. Troubleshoot unresponsive apps
If you come across an unresponsive app, you can always end the process and restart it to reset its state, which, in most cases, resolves the issue. However, if you want to troubleshoot the problem, Task Manager includes the "Analyze Wait Chain" feature to help identify and resolve app hangs and freezes.
The feature accomplishes this by providing a visual representation of the processes that are waiting for resources, helping you pinpoint the root cause of the issue.
To use this feature, in the "Details" tab, right-click the app that is not responding and choose the "Analyze Wait Chain" option.
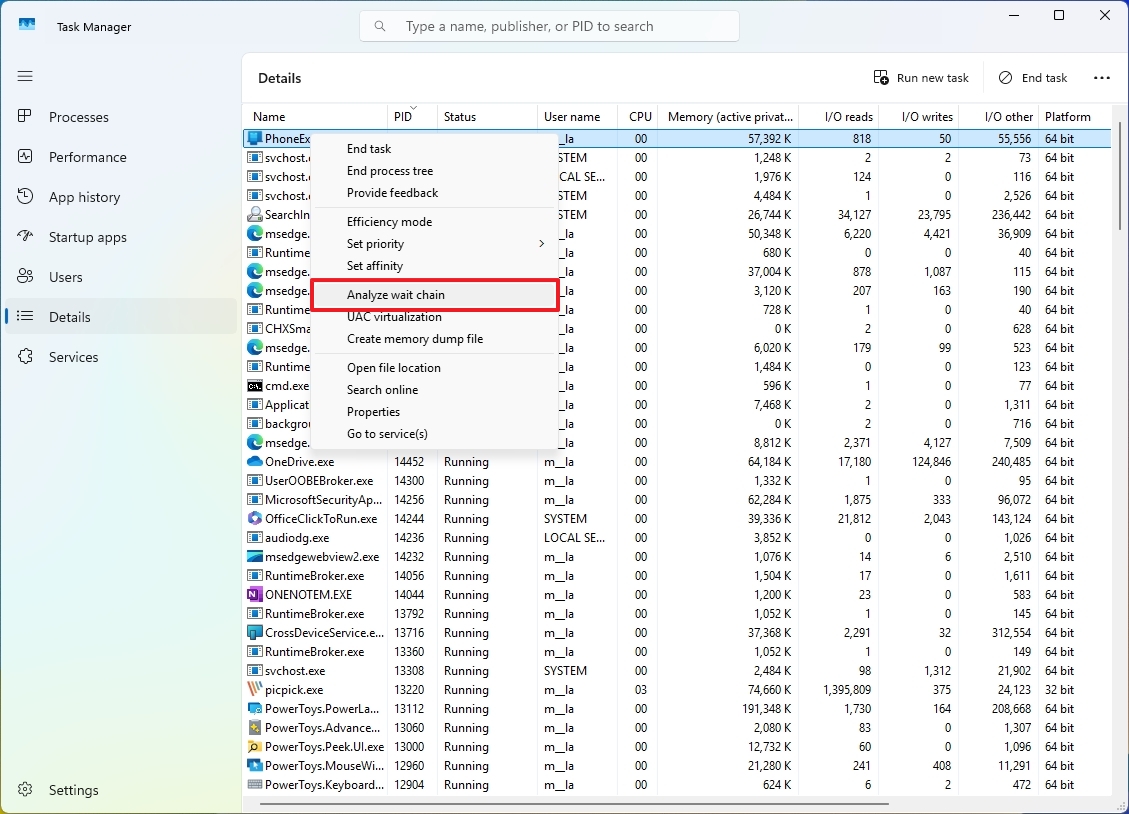
Once you select the option, the feature will display a tree-like diagram with each node representing a process, and the lines connecting the nodes indicate the waiting relationship between processes.
Although this feature can be handy to troubleshoot an unresponsive application, it's worth noting that it may not always provide a definitive answer. In some cases, the problem can be more complex and challenging.
13. Log off other users from your account
If you share the computer with other users and someone is still logged in, you may not be able to access their account, but you can always sign them out or check the running services quite easily from the Task Manager.
To check and review another logged-in user's services, click the "Users" tab and double-click on the user.
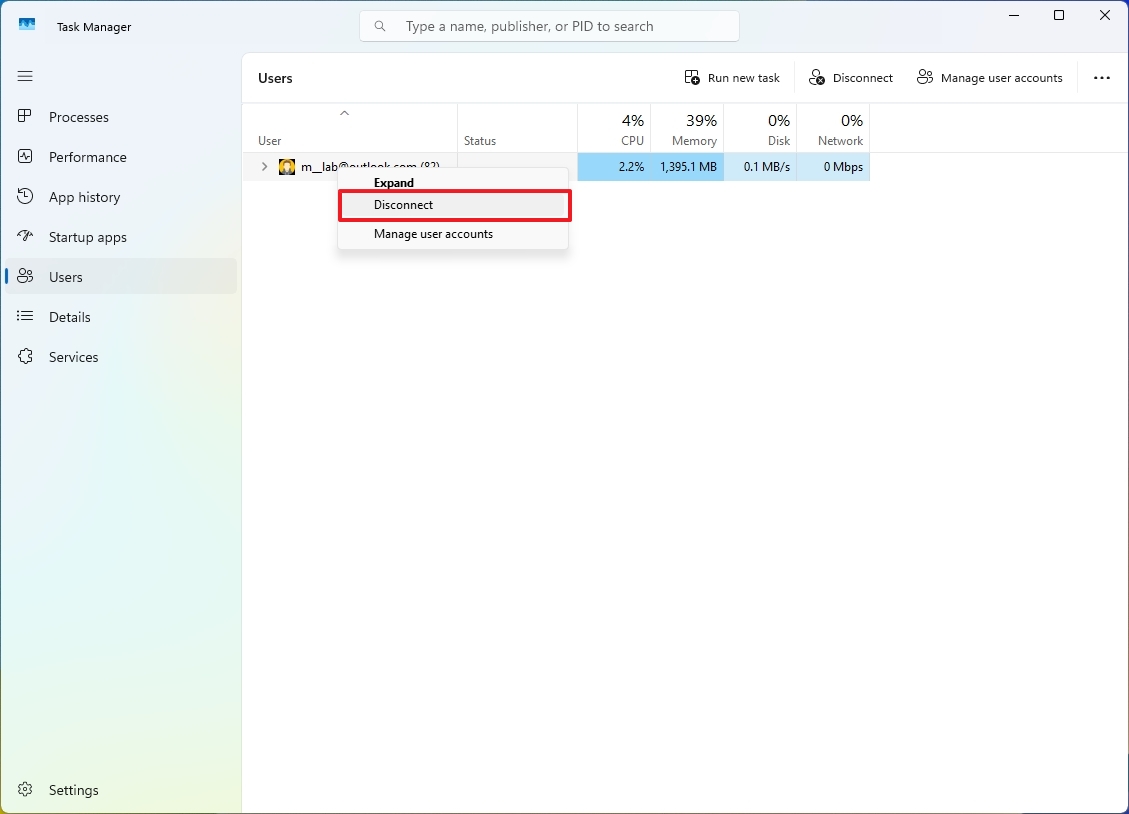
To sign someone off the computer, click the "Users" tab, right-click the user, and choose the "Disconnect" option.
14. Confirm process identification
When using the Task Manager, the Process Identifier (PID) is a unique number assigned to each running process on your computer, which you can use to find a specific process, or you can use it to terminate one directly with the "taskkill" command when troubleshooting a problem.
To find the PID of a specific process, click the "Details" tab and confirm the Process Identifier in the "PID" column.
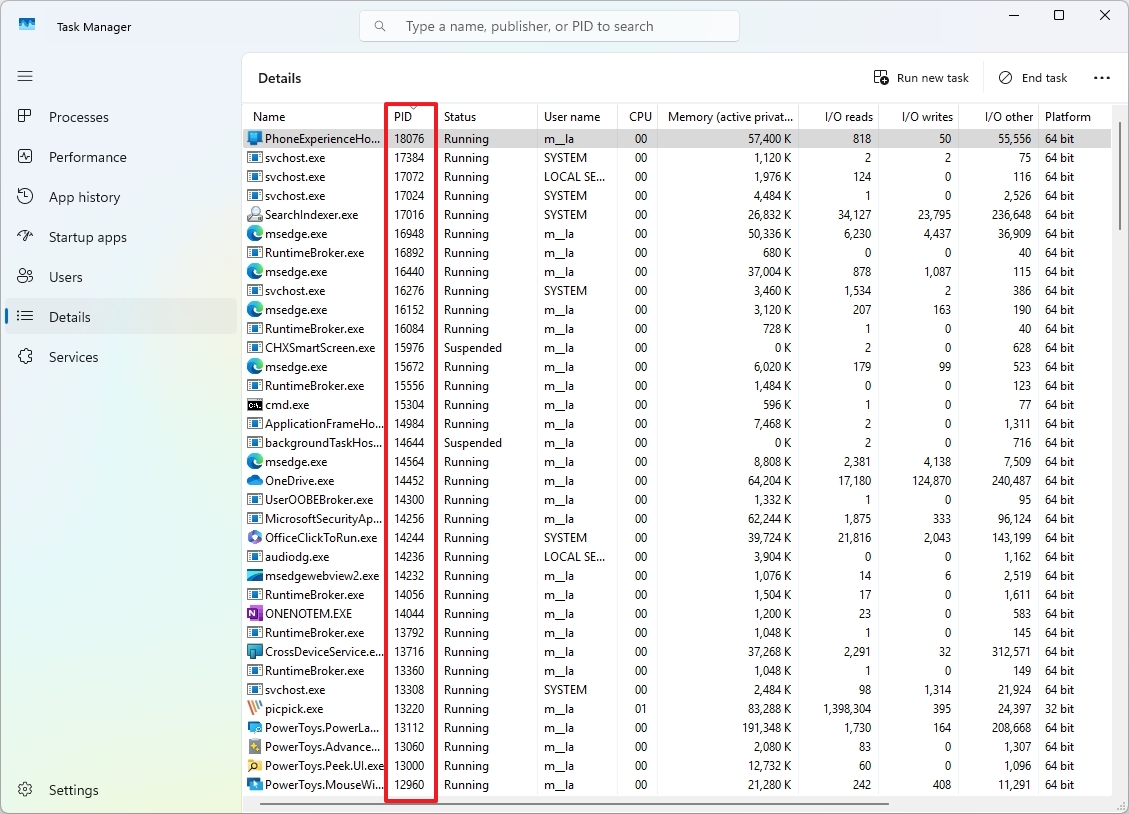
The system can also assign PID to many of the services running on the computer, and you can find them in the "Services" tab using the "PID" column.
15. Run apps as admin
On Windows 11, you can run an application or process with administrator rights in more than one way, including through the Task Manager.
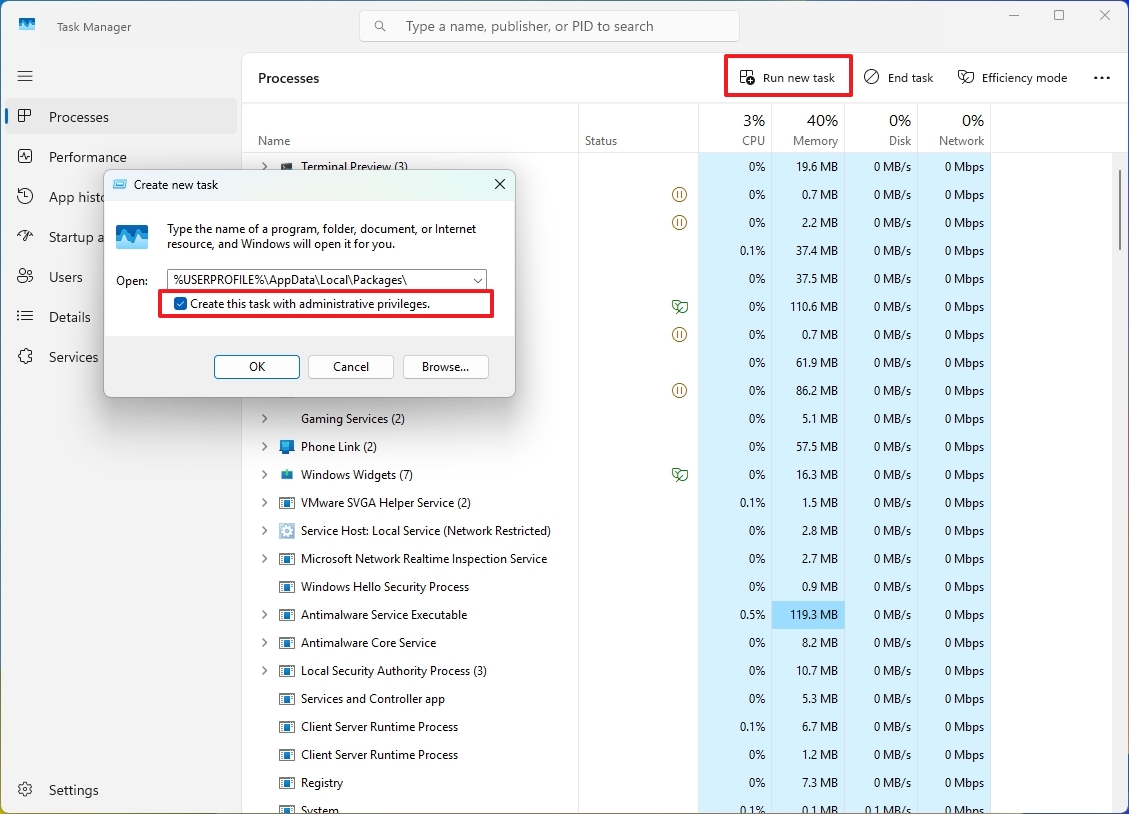
In Task Manager, from any tab, click the "Run new task" button at the top right to bring up the "Run" command, check the "Create this task with administrative privileges" option (if applicable), confirm the command for the app or task you want to run, and click the "OK" button.
16. Show always on top
The "Always on top" feature allows the Task Manager window to remain visible above other open windows on your screen. This is particularly useful when monitoring system resources or managing processes while working with other applications, especially full-screen ones.
To run Task Manager always on top, click the "Settings" button from the left pane and check the "Always on top" option under the "Window management" setting.
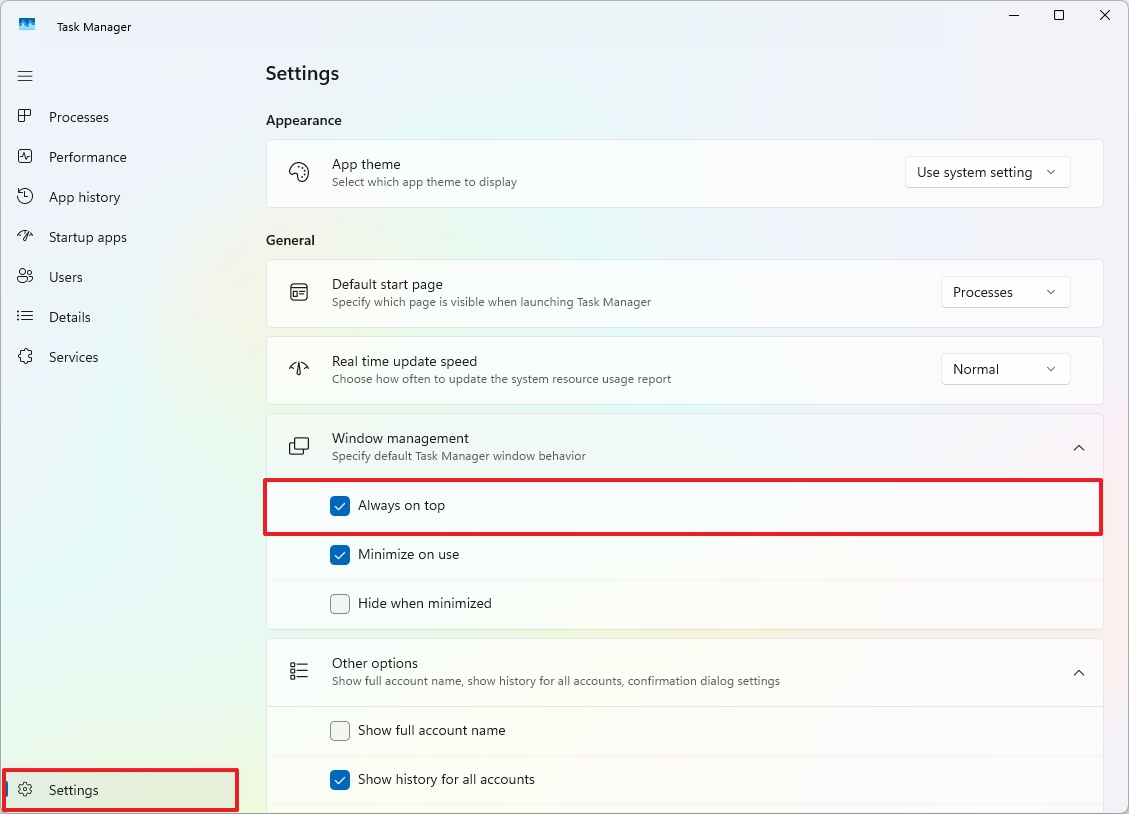
Once you enable the option, the Task Manager app will restart automatically.
You can always undo the changes by clearing the "Always on top" option under the "Window Management" setting.
17. Change default startup page
If you find yourself always opening Task Manager and then jumping to another tab other than the "Processes" tab, you can change the default behavior to open your preferred tab every time you launch the application.
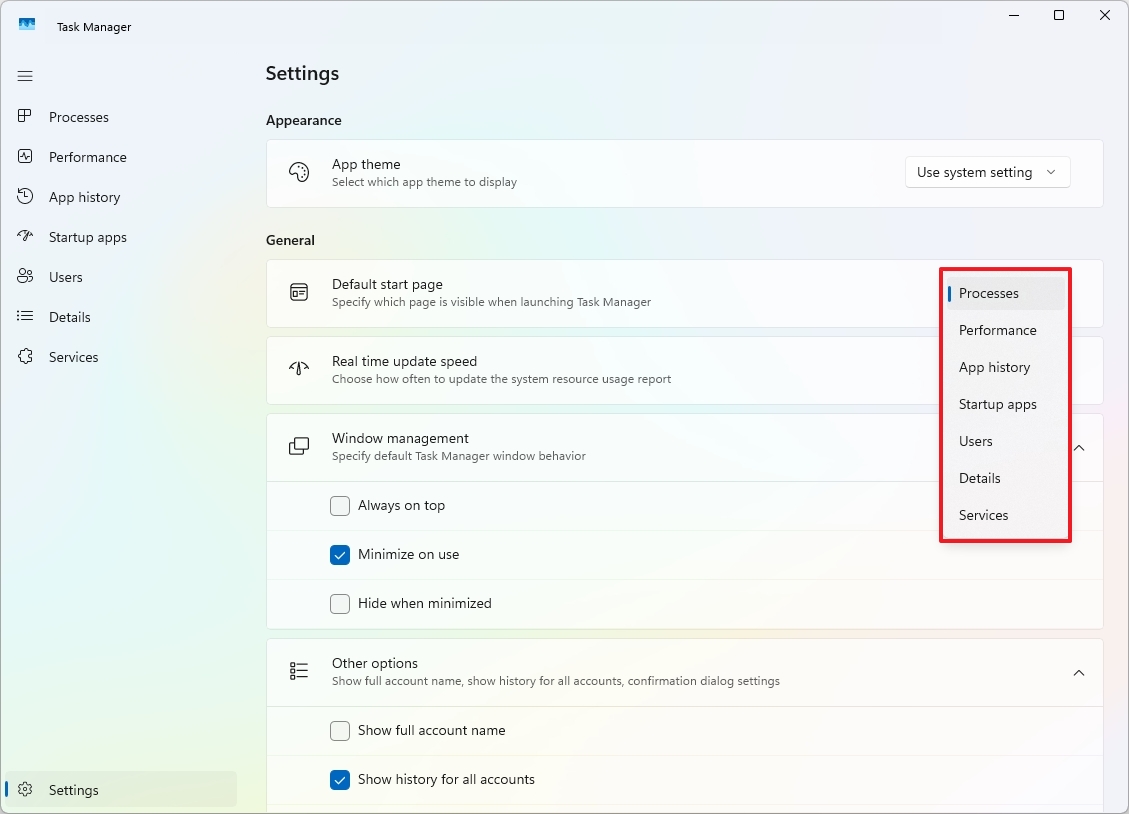
To change the default startup page of Task Manager, click the "Settings" button from the left pane and choose the page you want to launch every time you open Task Manager under the "Default start page" setting.
18. Other useful shortcuts
Many users are unaware, but Task Manager, like virtually any other application, includes shortcuts that allow you to navigate the interface with the keyboard.
General shortcuts:
- Tab: Switch between elements on the screen.
- Ctrl + Tab: Cycle through the tabs.
- Ctrl + Shift + Tab: Cycle through open tabs in reverse order.
- Alt + N – opens the dialog to run a new task.
- Ctrl+F: Open the search bar to find specific processes.
Processes tab:
- Spacebar and Enter: Opens and closes the selected process tree.
- Delete, Enter, and Alt + E: End the selected processes.
- Alt + V: Turns "Efficiency Mode" on or off.
19. Create desktop widget
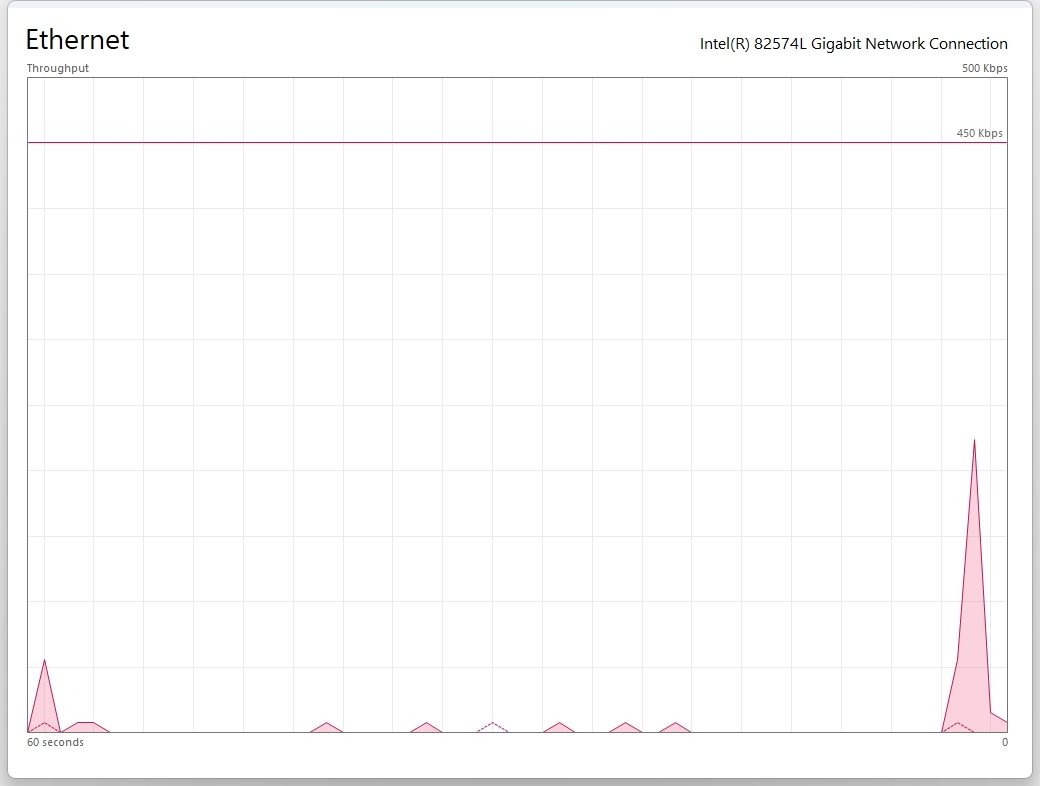
If you need to focus the Task Manager to monitor something specific, such as network traffic, processor, memory, or drive activity load, you can double-click any of the graphs to create a floating widget.
You can also right-click the graph and select the "Graph summary view" option to access the same view.
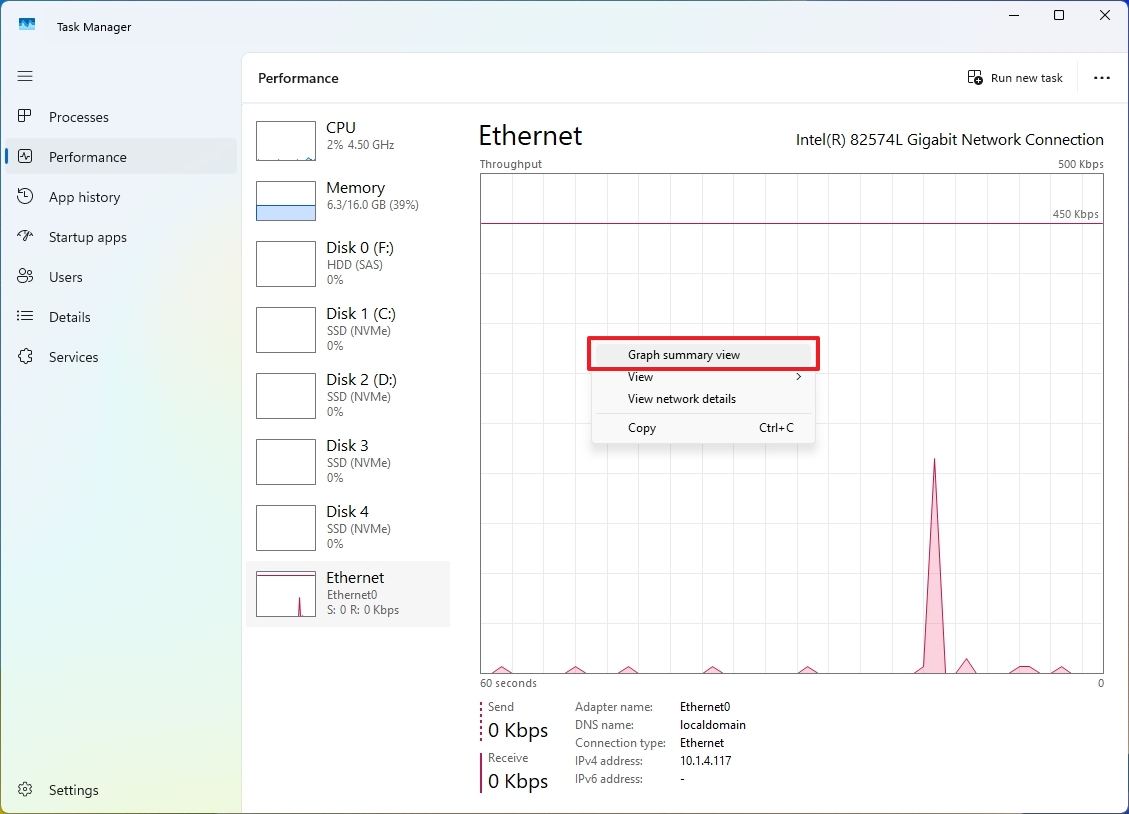
Once you're done monitoring, you can double-click the graph again to restore the Task Manager to its original experience.
More resources
For more in-depth insights, troubleshooting tips, and the latest updates on Windows 11 and 10, be sure to explore these resources:


