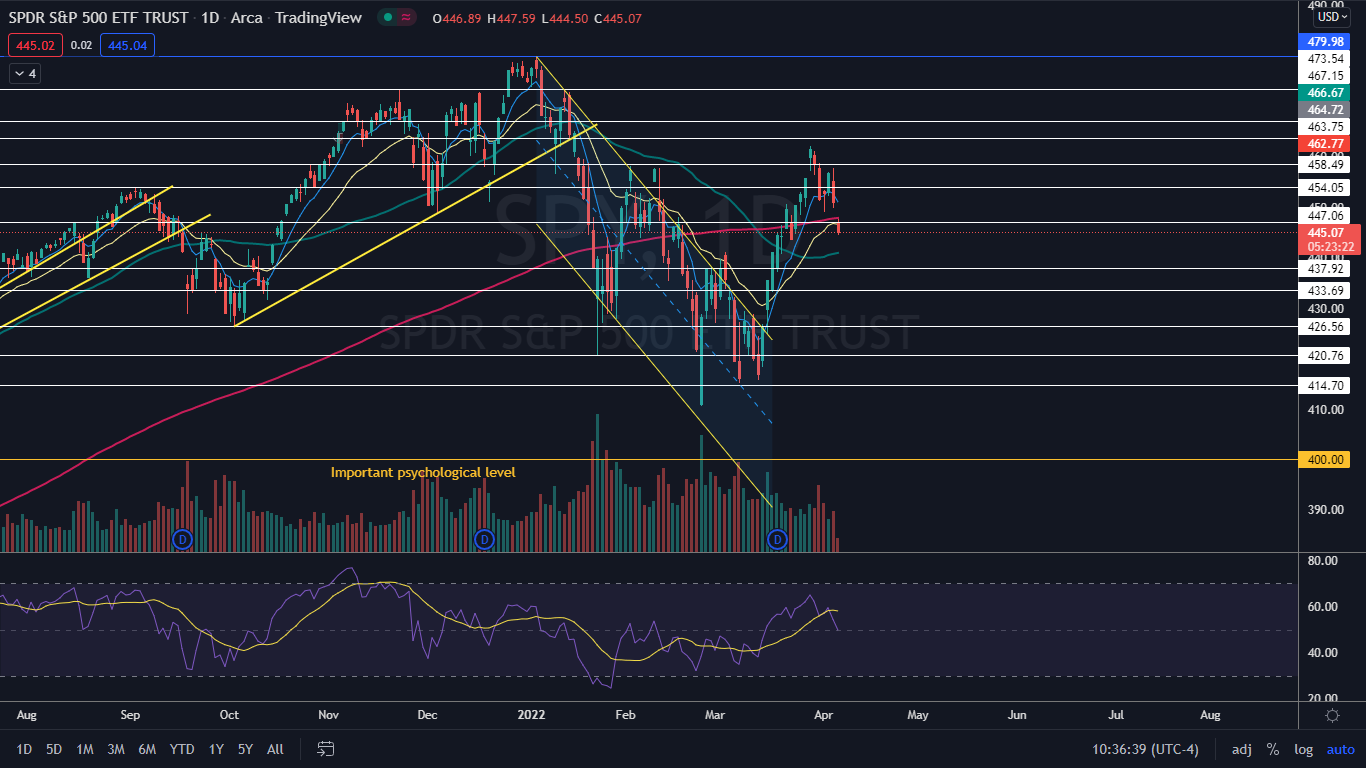
The SPDR S&P 500 (NYSE:SPY) gapped down 0.76% on Wednesday, for a total of a 3.14% decline since reaching a high of $462.07 on March 29.
Traders and investors have become jittery in anticipation the Federal Reserve will announce an aggressive rate hike when the central bank’s March meeting minutes are released at 2 p.m.
The gap down sunk the ETF under the 200-day simple moving average (SMA), which further spooked investors and caused more selling when the markets opened. The 200-day is an important bellwether indicator that marks the turning point between what is considered a bull versus a bear market.
The Russia-Ukraine crisis has also weighed on the market again recently as war crimes and human rights atrocities are discovered in newly liberated towns and cities in Ukraine, making further sanctions against Russia from the U.S. and European Union more likely.
The 10-year treasury yield, which indicates the level of investor confidence in the markets, jumped to 2.62% on Wednesday morning, the highest level since March, 2019. The move higher is partly due to continued momentum from Tuesday’s 28.19% rise, which was propelled by U.S. Federal Reserve Governor Lael Brainard’s hawkish comments. Brainard said the central bank may raise interest rates higher than the typical quarter-point increment in May to more forcefully combat soaring inflation.
The SPY’s price movement is likely to be choppy heading into the afternoon, as traders and investors await the central bank’s decision. Once the minutes are released, large swings typically take place, with the first move on lower timeframes sometimes heading the opposite way of the longer-term reaction.
The SPY Chart: On March 29, the SPY fell into a downtrend, which was confirmed on Tuesday when the ETF printed its first lower high at the $457.83 mark. On Wednesday, the SPY printed its second consecutive lower low under the most recent low of $449.14, which was created on April 1.
- The fall has caused the SPY’s relative strength index (RSI) to cross below the average and measure in at about 51%. When an RSI is near the 50% level it indicates indecision.
- The move lower on Wednesday was on lower-than-average volume, which indicates consolidation as opposed to fear in the market. The volume is likely to pick up after the Fed’s minutes are released, which will help to indicate which way the SPY is headed next.
- The SPY is trading below the eight-day and 21-day exponential moving averages (EMAs), but the eight-day EMA is trending above the 21-day. If the SPY is able to surge up to regain the eight-day EMA as support, a cross of the eight-day under the 21-day EMA will be avoided, which would be bullish.
- Although the SPY lost support of the 200-day SMA, the ETF is still trading above the 50-day. If there is a bearish reaction to the monthly minutes, the 50-day may act as support.
- The SPY has resistance above at $447.06 and $454.05 and support below at $437.92 and $433.69.


