The health of municipal finances is a critical element of municipal governance which will determine whether India realises her economic and developmental promise. The 74th Constitution Amendment Act was passed in 1992 mandating the setting up and devolution of powers to urban local bodies (ULBs) as the lowest unit of governance in cities and towns. Constitutional provisions were made for ULBs’ fiscal empowerment. However, three decades since, growing fiscal deficits, constraints in tax base expansion, and weakening of institutional mechanisms that enable resource mobilisation remain challenges. Revenue losses after implementation of the Goods and Services Tax (GST) and the pandemic have exacerbated the situation.
Comprehensive data sets on municipal finance are important to understand and counter these challenges, but few exist at the city level. Recently, the Indian Institute for Human Settlements (IIHS) analysed data from 80 ULBs across 24 States between 2012-13 and 2016-17 to understand ULB finance and spending, and found some key trends.
Share of own revenue
The first is that ULBs’ own sources of revenue were less than half of their total revenue, with large untapped potential. The ULBs’ key revenue sources are taxes, fees, fines and charges, and transfers from Central and State governments, which are known as inter-governmental transfers (IGTs). The share of own revenue (including revenue from taxes on property and advertisements, and non-tax revenue from user charges and fees from building permissions and trade licencing) to total revenue is an important indicator of ULBs’ fiscal health and autonomy. This ratio reflects the ULBs’ ability to use the sources they are entitled to tap, and their dependency on IGTs. Cities with a higher share of own revenue are more financially self-sustaining.
Our study found that the ULBs’s own revenue was 47% of their total revenue. Of this, tax revenue was the largest component: around 29% of the total. There was a 7% increase in own revenue from 2012-13 to 2016-17, but ULBs still lacked revenue buoyancy as their share in GDP of own revenue was only 0.5% for the five-year period.
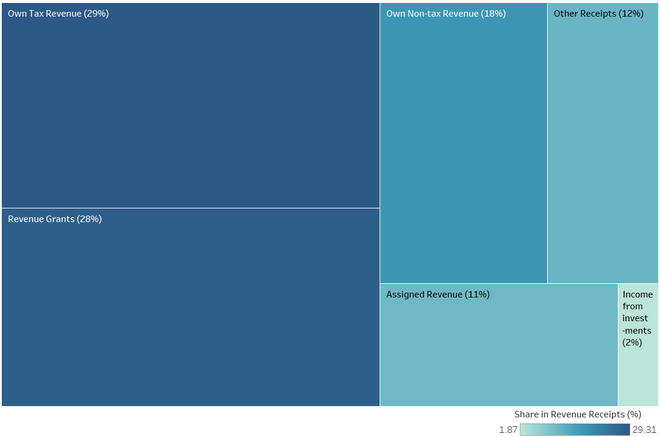
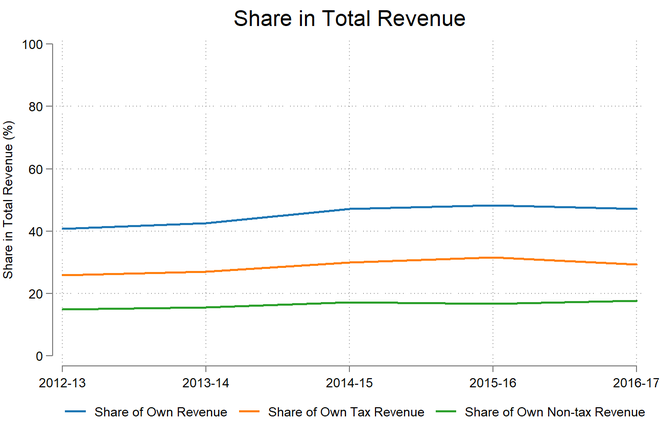
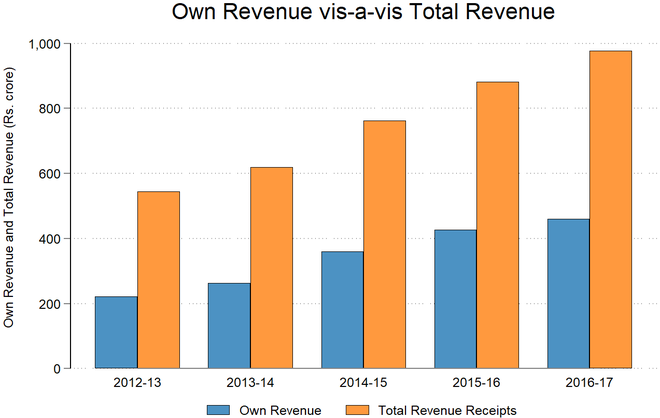
Property tax, the single largest contributor to ULBs’ own revenue, accounted for only about 0.15% of the GDP. The corresponding figures for developing and developed countries were significantly higher (about 0.6% and 1%, respectively) indicating that this is not being harnessed to potential in India. Estimates suggest that Indian ULBs’ can achieve these levels. It is essential that ULBs leverage their own revenue-raising powers to be fiscally sustainable and empowered and have better amenities and quality of service delivery.
Dependent on IGTs
Second, many ULBs were highly dependent on IGTs. Transfers from the Central government are as stipulated by the Central Finance Commissions and through grants towards specific reforms, while State government transfers are as grants-in-aid and devolution of State’s collection of local taxes. Most ULBs were highly dependent on external grants — between 2012-13 and 2016-17, IGTs accounted for about 40% of the ULBs’ total revenue.
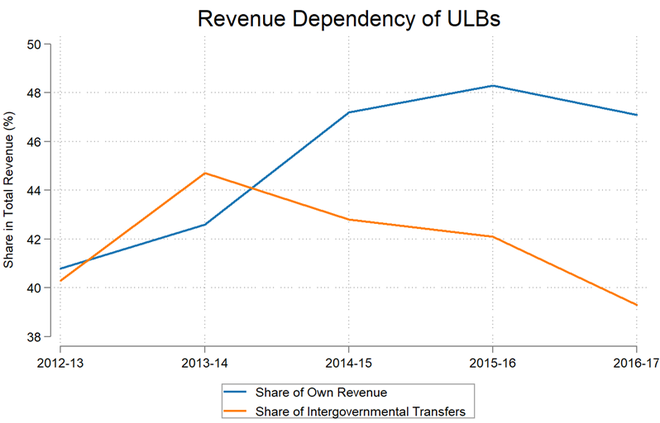
Stable and predictable IGTs are particularly important since ULBs’ own revenue collection is inadequate. While dependence on IGTs dipped over the years due to modest increase in own revenue, the scale of IGTs in India remained at around 0.5% of GDP, which is far lower than the international average of 2% to 5% of GDP.
This can be improved by increasing the revenue assigned to ULBs from the State governments, and by allocating a share of the State and Centre’s GST proceeds to ULBs. This will cushion ULBs’ balance sheets as they mobilise their own revenue and explore market-based instruments. IGTs can also incentivise ULBs to deliver better service quality and maintain fiscal discipline.
Third, tax revenue is the largest revenue source for larger cities, while smaller cities are more dependent on grants. There are considerable differences in the composition of revenue sources across cities of different sizes. Class I-A cities (population of over 50 lakh) primarily depend on their own tax revenue, while Class I-B cities and Class I-C cities (population of 10 lakh-50 lakh and 1 lakh-10 lakh, respectively) rely more on IGTs.
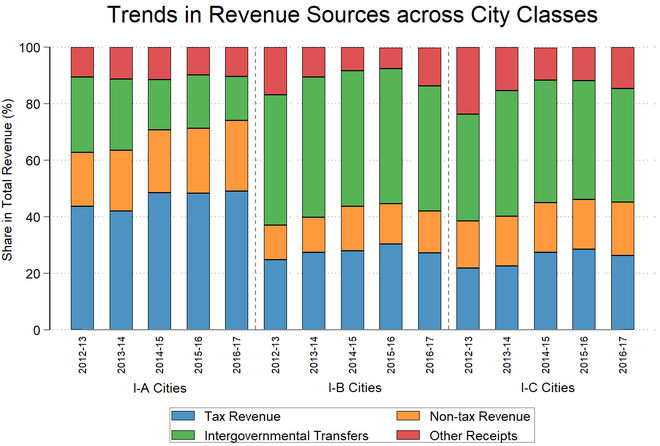
Own revenue mobilisation in Class I-A cities increased substantially. It was primarily driven by increases in non-tax revenue. In the five-year period studied, tax revenue in Class I-A cities grew by about 11%, while non-tax revenue grew by about 30%. The external revenue dependency of these larger cities gradually reduced over time, from around 27% in 2012-13 to about 15% in 2016-17. Own revenues of Class I-B and Class I-C cities, on the other hand, were stagnant even while these cities grew in size.
Operations and maintenance
Fourth, operations and maintenance (O&M) expenses are on the increase but still inadequate. O&M expenses are crucial for the upkeep of infrastructure and for maintaining quality of service delivery. The share of O&M expenses in ULBs’ total revenue expenditure increased from about 30% in 2012-13 to about 35% in 2016-17. While the expenses were on the rise, studies (such as ICRIER, 2019 and Bandyopadhyay, 2014) indicate that they remained inadequate. For instance, O&M expenses incurred in 2016-17 covered only around a fifth of the requirement forecast by the High-Powered Expert Committee for estimating the investment requirements for urban infrastructure services.
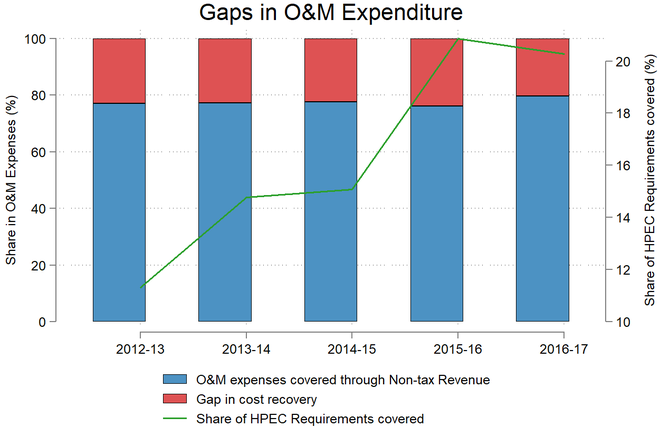
O&M expenses should ideally be covered through user charges, but total non-tax revenues, of which user charges are a part, are insufficient to meet current O&M expenses. Cost recovery for services such as water supply, solid waste management, transportation and waste water management are thus clearly inadequate.
The non-tax revenues were short of the O&M expenditure by around 20%, and this shortfall contributed to the increasing revenue deficit in ULBs. Increasing cost recovery levels through improved user charge regimes would not only improve services but also contribute to the financial vitality of ULBs.
The scale of municipal finances in India is undoubtedly inadequate. A ULB’s realised own revenue resources are far below the estimated potential. Tapping into property taxes, other land-based resources and user charges are all ways to improve the revenue of a ULB. IGTs assume significance in the fiscal composition of ULBs, and a stable support from Central and State governments is crucial till ULBs improve their own revenues. Measures need to be made to also cover O&M expenses of a ULB for better infrastructure and service.
Amir Bazaz is a Senior Lead and the Associate Dean of the School of Environment and Sustainability and Madhumitha Srinivasan is Research Assistant, both at IIHS. Manish Dubey, Chief of the Practice Programme at IIHS, contributed to the article


