Hello and welcome to the last edition of The Crunch for 2025! We’ll be taking a break over the Australian summer holidays and will be back in late January or early February, whenever the charts start flowing again from the great content spigot that is the internet.
So, as is our annual Crunch tradition, we’ll be picking our favourite pieces of the year. And this time we’re going to open comments on the web version of the newsletter, so please do jump in and let us know if there was a particularly great piece of datavis you saw in 2025!
Josh’s picks for 2025
This is in no particular order. And, unlike previously, I’m going to make an effort not to pick so many illustrations. So I won’t include this powerful story about prison trees. This is out, and so is this and this (I’ll stop now).
***
Best thing since diced sliced bread
What’s the best way to dice an onion into uniform pieces? For most recipes this won’t actually make much difference. But The Pudding went so hard at answering it they even created their own onion font:
Beyond how extra this all is, it’s also a great example of the power of tiny interactives. This relatively simple abstraction makes it so tangible. That you can play with it, even more so.
***
Why is clothes shopping such a guessing game?
This story from the Straits Times tackles such a common problem I can’t believe it hadn’t been done before – why can one person be a size small from one clothing brand, but a medium or large from others?
There are videos, 3D models and so much more in this piece. You should definitely check it out.
***
Vaccines work
This chart from Our World in Data (and inspired by this from the Wall Street Journal) condenses so much information – a change over time, across so many groups, into just one static view.
Visualising this many dimensions is surprisingly tricky. The easiest thing to do is to lean into the complexity, and create multiple graphics, or one with a bunch of moving parts. OWID went the other way, and it works precisely because the idea its trying to convey is so clear. The whole article is worth a read.
***
A very, very, very big chart
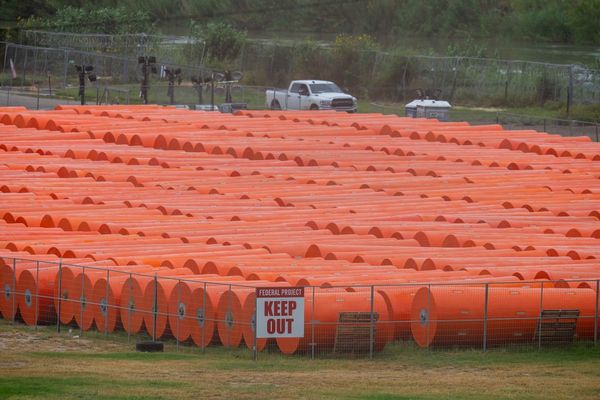
OK I’m bending my no-illustrations rule to choose this very big chart that Nick and I made to visualise the 87.9m tonnes of annual emissions expected from Woodside’s North West Shelf gas project.
Each square in the chart represents 500 tonnes of carbon dioxide. We tried squares representing 10 or even 100 tonnes, but the expected emissions are just so large that the number of squares required kept crashing our browsers.
Honourable mentions to this Reuters story about whether there are any safe seats in a plane crash, this one about hurricane hunting planes, and this ABC one on skimpflation.
Nick’s picks for 2025
This list is in no particular order, it’s just a shortlist of great things that I noted when reading through all of our newsletters this year.
***
Deadly rivers in the sky
I love a good map, especially with an animated globe projection. This piece from the Washington Post really stuck in my memory for being just a really well done piece of datavisualisation on an important topic.
Read more here.
***
Mona Chalabi on starvation in Gaza
The inimitable Mona Chalabi had a lot of great work in 2025, but her very simple illustration highlighting starvation in Gaza was a standout for me.
See the original here.
***
Lego charts and a voting matrix
Josh and I thought we should pick what we liked best from our own work this year – as it is our newsletter, we can be as self-indulgent as we like. However, I couldn’t make a decision between the next two pieces so I’m just putting them both in (sorry).
I loved working on this piece about how Australian politicians vote for a few reasons. Firstly, it addressed an important claim during the election campaign and showed that there was much more to it.
The second reason is that it was just enjoyable to do – it was a project that involved a bit of scraping or data work with python, a bit of fancy datavis in javascript, and a nice, contained, blog-style article with charts.
My second pick is the Lego chart I made for our One Big Chart series:
This was a chart on an important topic but, again, it was enjoyable to work on because of the creativity involved. I also roped in my colleagues on the video team to do a time-lapse version!
***
Pudding dot cool
Look we feature a lot of work from The Pudding. Which is understandable, as they do some great stuff. So again, it was hard to whittle it down to just one piece, so I’ve chosen two.
Alvin “Purple Colour Palette” Chang’s piece visualising an experiment tracking how people hold conversations is an amazing piece of work and you should check it out if you haven’t seen it already (but you probably have because you are a discerning Crunch reader).
The other piece I really liked from the Pudding was this piece charting the evolution of the love song in the Billboard charts. It has some great charts and a fun thesis.
Also, notably, it is one of the few pieces of work that makes sensible use of large language models to categorise text (which is one thing they are definitely good at!).
***
A big year for birds
On top of BIRD OF THE YEAR our UK colleagues also produced this lovely piece which uses GPS mapping of bird movements to show how migration patterns are changing in response to a changing climate. It has some lovely illustrations, and very nicely designed maps and is definitely worth checking out if you haven’t already!
What was your favourite?
We’re opening comments up on the web version of the newsletter, so please feel free to jump in and nominate your favourite thing for the year. Head to the Crunch page and click on the latest article.
Sign up
If you would like to receive The Crunch to your email inbox every fortnight, sign up here.