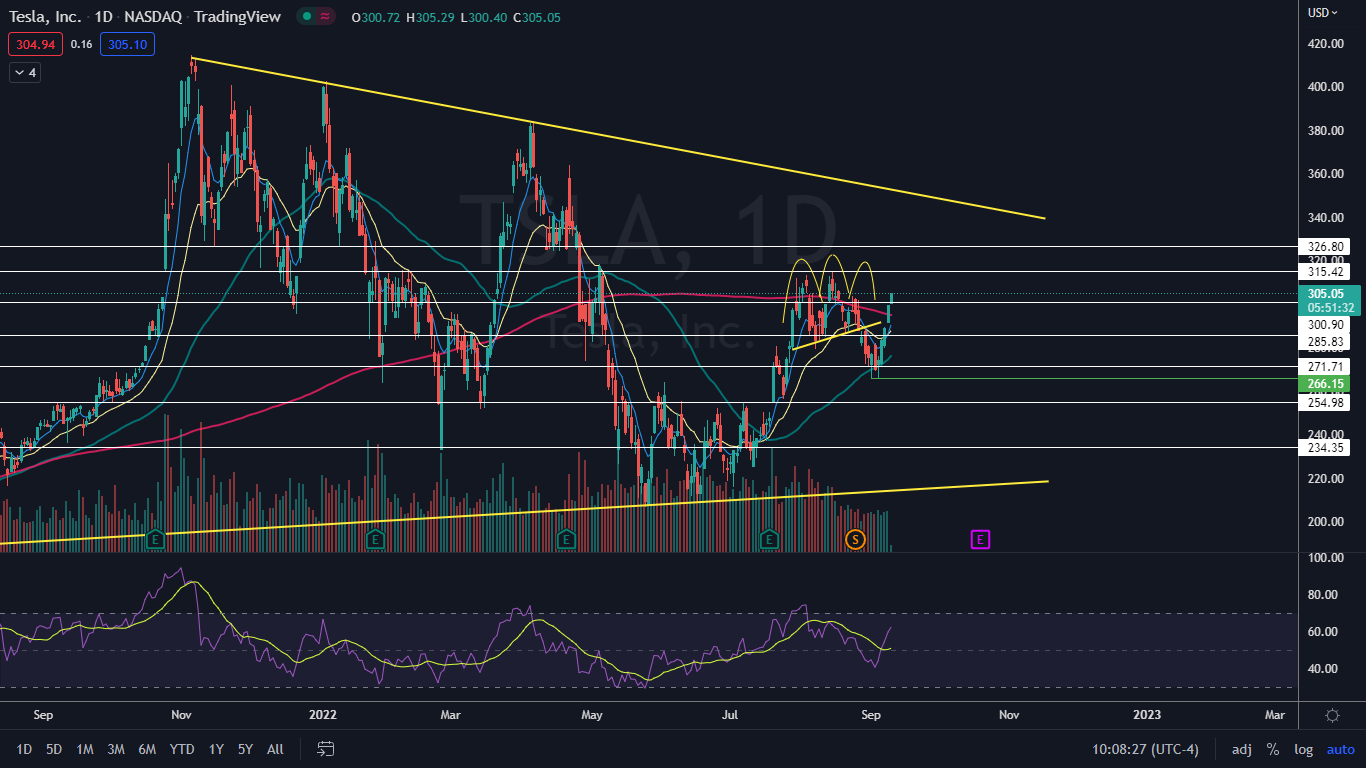
Tesla, Inc (NASDAQ:TSLA) was spiking up over 1% higher on Monday after a big bullish day on Friday caused the stock to rise 2.9% off the open and reclaim the 200-day simple moving average (SMA) as support.
The 200-day SMA is an important bellwether. Technical traders and investors consider a stock trading above the level on the daily chart to be in a bull cycle, whereas a stock trading under the 200-day SMA is considered to be in a bear cycle.
The 50-day SMA also plays an important role in technical analysis, especially when paired with the 200-day. When the 50-day SMA crosses below the 200-day SMA, a death cross occurs, whereas when the 50-day SMA crosses above the 200-day, a bullish golden cross takes place.
A death cross occurred on Tesla’s chart in May, which dropped the stock into a long-term bear cycle. In August, Tesla popped up above the 200-day on several occasions, but was unable to hold above the level for any length of time.
When Tesla last attempted to cross above the 200-day on Aug. 24, Aug. 25 and Aug. 26, the stock rejected the area and entered a downtrend that caused Tesla to decline 12% to a Sept. 1 low of $266.15. Tesla tested that low as support again on Sept. 6, which caused the stock to print a double bottom pattern at the level.
In reaction to the bullish double bottom, Tesla rebounded about 10% and on Friday the stock crossed back up above the 200-day SMA.
Traders and investors will be watching to see if Tesla can hold above the level this time and if the stock can remain above the 200-day for a period of time, a golden cross will occur.
Want direct analysis? Find me in the BZ Pro lounge! Click here for a free trial.
The Tesla Chart: Although Tesla negated its most recent downtrend, the stock has yet to confirm a new uptrend. For an uptrend to confirm on the daily chart, Tesla will need to retrace to print a higher low. Now that Tesla is above the 200-day, the higher low may occur on a back test of that level.
- On Friday, Tesla printed a bullish kicker candlestick, which indicated the stock would trade higher on Monday. If Tesla closes the trading day Monday near the high-of-day, the stock will print a second bullish kicker candlestick, which could indicate higher prices will come again on Tuesday.
- If Tesla gaps slightly up again on Tuesday and prints a third bullish kicker candlestick, the stock may retrace on Wednesday due to the creation of a three-gap-up-reversal pattern. If the stock falls on Monday to print a shooting star candlestick, a retracement may be in the cards for Tuesday.
- If Tesla confirms an uptrend and continues to trend higher over the coming days, the stock may find resistance at the upper descending trendline of a long-term triangle pattern, which the stock has been trading in since Nov. 5, 2021. Traders looking to exit a long position or take a short position may choose to watch for Tesla to print a bearish reversal candlestick at the top of the pattern.
- Tesla has resistance above at $315.42 and $326.80 and support below at $300.90 and $285.83.

See Also: Tesla, Nio EV Battery Supplier CATL's Chinese Rival CALB Eyes $2B Hong Kong IPO: Report


