
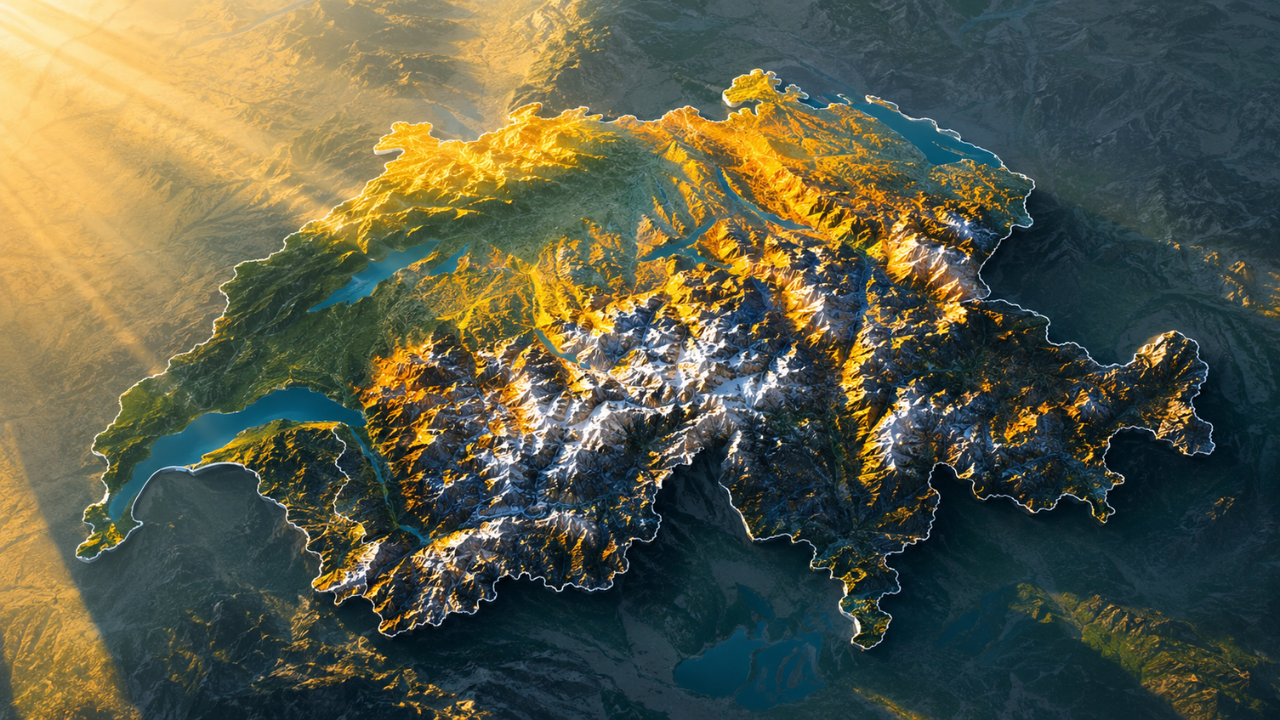
Scientists in Switzerland have done something that sounds almost impossible. They have built a map showing exactly how much sunlight reaches the ground at every single spot in the country, even right down to the shadow of a single tree. A new national map shows light and shade across Switzerland at a scale of about 33 feet, fine enough to account for the shadow of individual trees. Reportedly, researchers at the WSL Institute for Snow and Avalanche Research (SLF) calculated ground-level light across both open and forested landscapes;they also made data public through the EnviDat platform. The dataset is called SwissRad10, and it could change how scientists, planners, and land managers understand snow, forests, water, and climate across an entire country.
Get breaking news anytime, anywhere. Download the TOI app now!
How sunlight map tracks every shadow across Switzerland
The study published at Scientific Data titled; “ Hourly potential light availability maps at 10 m resolution over Switzerland ” it helps to understand what scientists mean by "light availability." Light availability simply means how much light actually reaches the land surface after mountains, hills, tree crowns, and buildings cast their shadows. Think of it as the difference between standing in an open car park at noon versus standing beneath a thick canopy of trees in the same country with completely different light.
That gap matters more than it might seem. One patch of ground may sit in sunlight for hours, while a nearby patch remains cool and shaded for most of the day. In mountain terrain, that small shift can have big consequences.
What makes SwissRad10 stand out is also its timing. The new dataset follows those changes hour by hour through a full annual solar cycle. This means researchers can look at how light changes across seasons, not just from morning to afternoon.
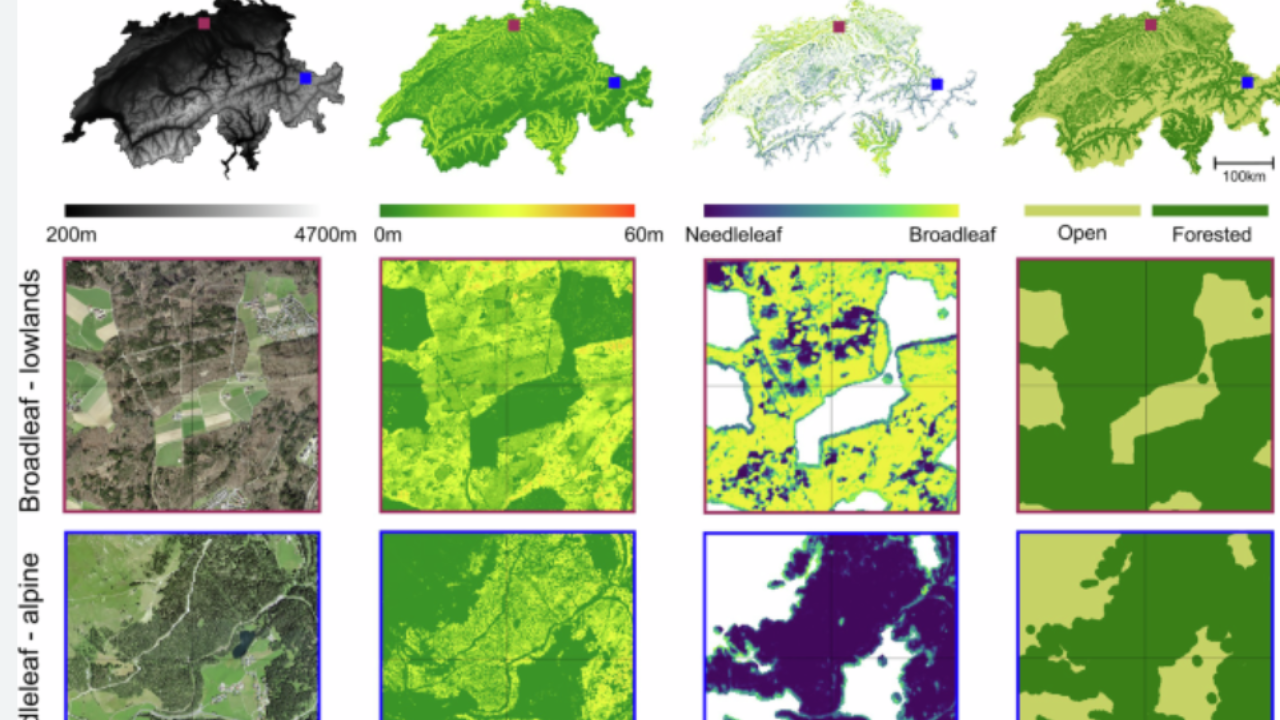
The dataset was calculated using the detailed synthetic hemispheric image-based Canopy Radiation Model (CanRad) with the latest airborne lidar and terrain surface data from the swissSURFACE3D dataset, and resolves the shadow cast by every single tree in Switzerland.
In plain terms, the map captures two types of light: the bright direct beam from the sun, and the softer scattered light that reaches the ground even when a spot is in shadow.
Why snow and water make this map so important
Snow is one of the main reasons this map matters. Across Switzerland, about one third of precipitation falls as snow, and that frozen water affects floods, hydro power, winter sports, and local ecosystems.
Most people think of snow simply as something cold and white. But where it melts and when, has enormous consequences for communities and infrastructure. When sunlight reaches a snow pack early in the year, snow tends to melt faster than it does on shaded slopes nearby. That can influence river levels and flood warnings, especially during spring melt.
Better snow melt forecasts can help managers understand when water may flow into reservoirs. That can connect mountain shadows to very real energy decisions, even the kind that eventually show up in the electric bill.
Forests, tiny climates, and why biodiversity depends on shade
Beyond snow and water, the map opens up a new way of looking at life inside forests. Inside a forest, conditions can change eventually. One spot may be cool, while another gets enough sun to warm the ground and help plants grow. These small zones are called micro climates, which are local climate pockets within a larger area.
These tiny differences are not just interesting but they are essential. Plants, insects, fungi, and animals often depend on them.This data is important for assessing forest suitability for both plants and animals, for disciplines linked through forest micro climate such as bio -geo -chemistry and snow modelling, as well as for ecosystem research.
An earlier version of the dataset was already put to work in the field. It was used in micro climate mapping research in Switzerland, helping scientists show how solar radiation shapes forest temperature patterns and local habitat conditions. That matters more as heat waves and shifting seasons put pressure on ecosystems.
The practical uses stretch well beyond academic research. The data could help people who manage forests, monitor natural hazards, study biodiversity, or plan conservation work. Better sunlight maps can also sharpen environmental models that depend on land surface energy.