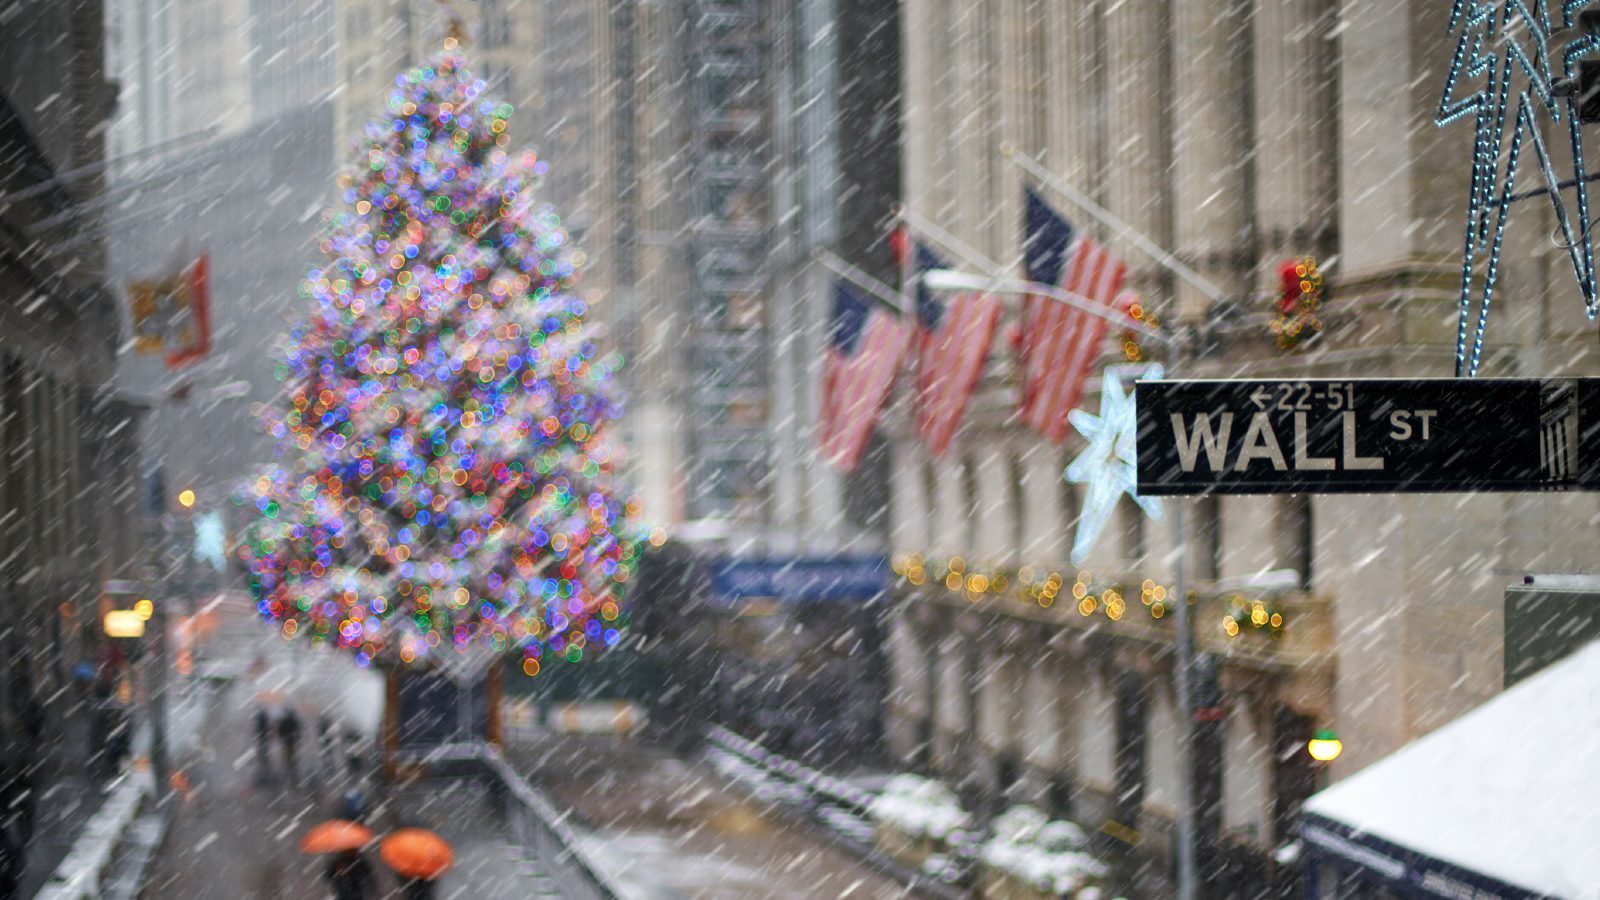
Markets digested recent gains ahead of the long holiday weekend on Friday. While a cooler-than-expected reading on the Fed's favorite inflation gauge boosted bets for additional interest rate cuts next year, some downbeat earnings news kept overall gains in check.
At the closing bell, the blue-chip Dow Jones Industrial Average slipped less than 1% to finish at 37,385, while the broader S&P 500 rose 0.2% to 4,754. The tech-heavy Nasdaq Composite added 0.2% to finish at 14,992.
All three benchmarks posted an eighth consecutive weekly gain. The S&P 500 hasn't enjoyed a weekly winning streak this long since late 2017. It's now down less than 1% on a price basis from its record close of January 3, 2022. For the Nasdaq and the Dow, these are the longest such weekly winning streaks since the beginning of 2019.
In economic news, the Federal Reserve's preferred gauge of inflation rose only slightly in November – and is close to the central bank's target by some measures. On a core basis, which excludes volatile food and energy costs, the PCE index rose 0.1% last month vs October, and 3.2% year-over-year, the Bureau of Economic Analysis said Friday.
Economists note that on a six-month basis, core PCE increased 1.9% – or below the Fed's long-term inflation target of 2%.
"Inflation continues to surprise to the downside, with the Fed's preferred metric of core PCE rising just 0.1% month-over-month in November," notes Sonu Varghese, global macro strategist at Carson Group. "This raises the odds for a rate cut in March."
In single-stock news, Nike (NKE) stock tumbled 12% after the athletic footwear and apparel maker lowered its full-year forecast, citing a cautious consumer. Nike was by far the worst performer among all 30 Dow Jones stocks Friday.
Elsewhere, shares in Occidental Petroleum (OXY) got a lift after a regulatory filing showed that Warren Buffett's Berkshire Hathaway portfolio raised its stake in the oil giant.
Santa Claus Rally starts Friday
The Santa Claus Rally – identified in the early 1970s by the creator of the Stock Trader's Almanac – doesn't mean what a lot of folks think it means.
The Santa Claus Rally is not when stocks have a great December. If you go all the way back to the 1920s, you'll see that December is typically the seasonally strongest month of the year for stocks, anyway. Rather, the Santa Claus Rally refers to the final five trading days of the year, plus the first two trading days of the new year.
"Historically, it turns out these seven days indeed have been quite jolly," writes Ryan Detrick, chief market strategist at Carson Group. "No seven-day combo is more likely to be higher (up 79.5% of the time), and only two combos have a better average return for the S&P 500 than the 1.32% average return during the official Santa Claus Rally period."
The Santa Claus Rally period kicked off Friday with a decent gain for the S&P 500. If history is any guide, market participants should expect a happy new year, too.


