/Semiconductor%20by%20Gorodenkoff%20via%20Shutterstock.jpg)
When it comes to price appreciation, there’s nothing “semi” about semiconductors. It is all in on profit-making for traders and investors alike.
Their growth has reached the point where this industry within the technology sector of the S&P 500 Index ($SPX) has taken up an unusual amount of space. What does that mean for you?
The industry group has ballooned to an unprecedented 14% of the S&P 500’s total market weight. To put that in perspective, a single niche of the technology sector now carries more weight than the entire Energy, Materials, and Utilities sectors combined.
This isn’t just growth; it is a fundamental restructuring of the market.
Semiconductors have transitioned from a cyclical “commodity” business into the high-margin “infrastructure” layer of the global economy. If the S&P 500 is the house, semiconductors are no longer just the wiring — they are now the foundation.
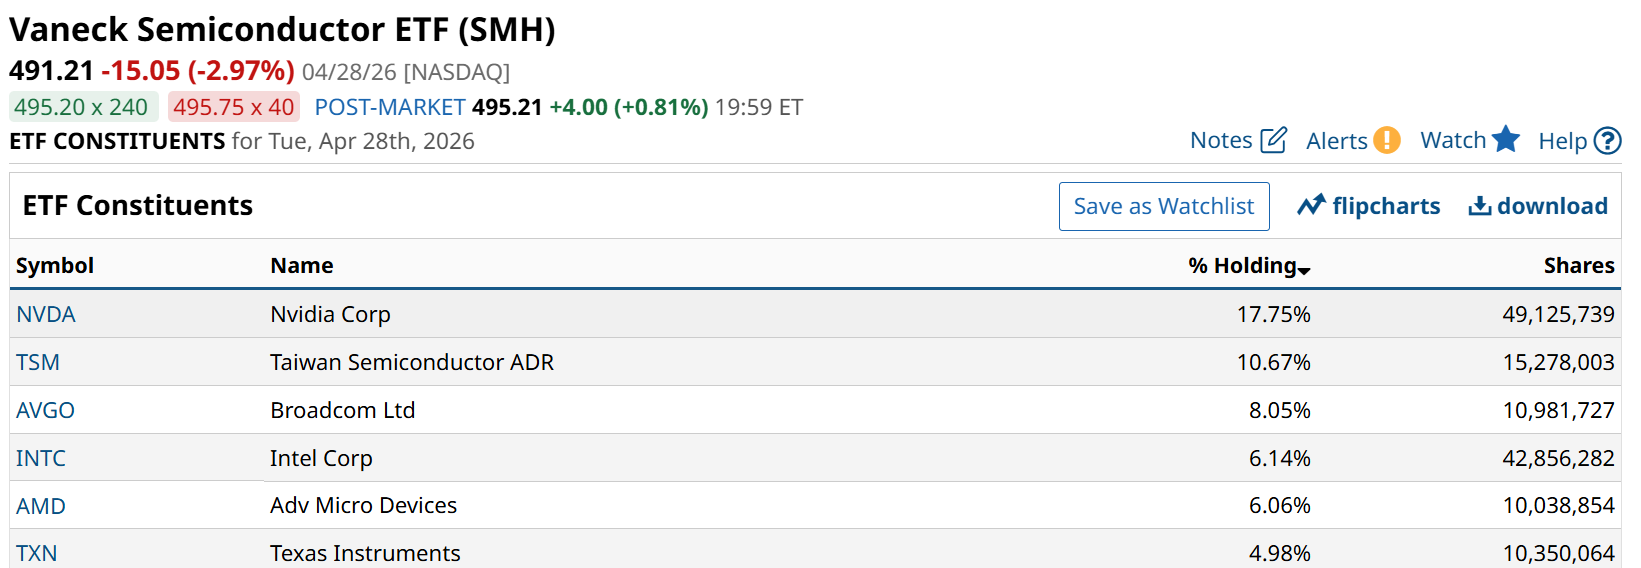
The primary driver of this 14% concentration is Nvidia (NVDA). In unconstrained ETF like the VanEck Semiconductor ETF (SMH), the top holdings have expanded so rapidly that just these six names now account for over 53% of the portfolio.
When 14% of the index moves in lockstep, it dictates the direction of your entire portfolio, regardless of what your other stocks are doing. And while demand for AI chips is at record highs, the market is beginning to punish hardware names that don’t show an immediate return on investment (ROI).
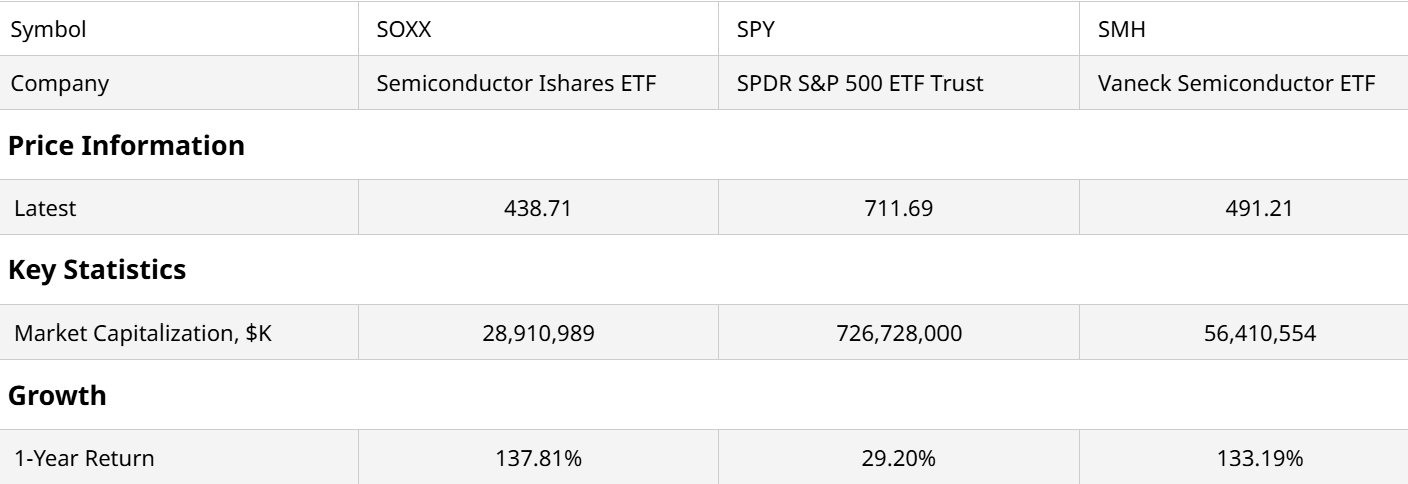
This table shows just how much influence semiconductor stocks have had on lifting the S&P 500 ETF (SPY) over the past 12 months. Without semis, the index would likely be about 7%-8% lower, at least.
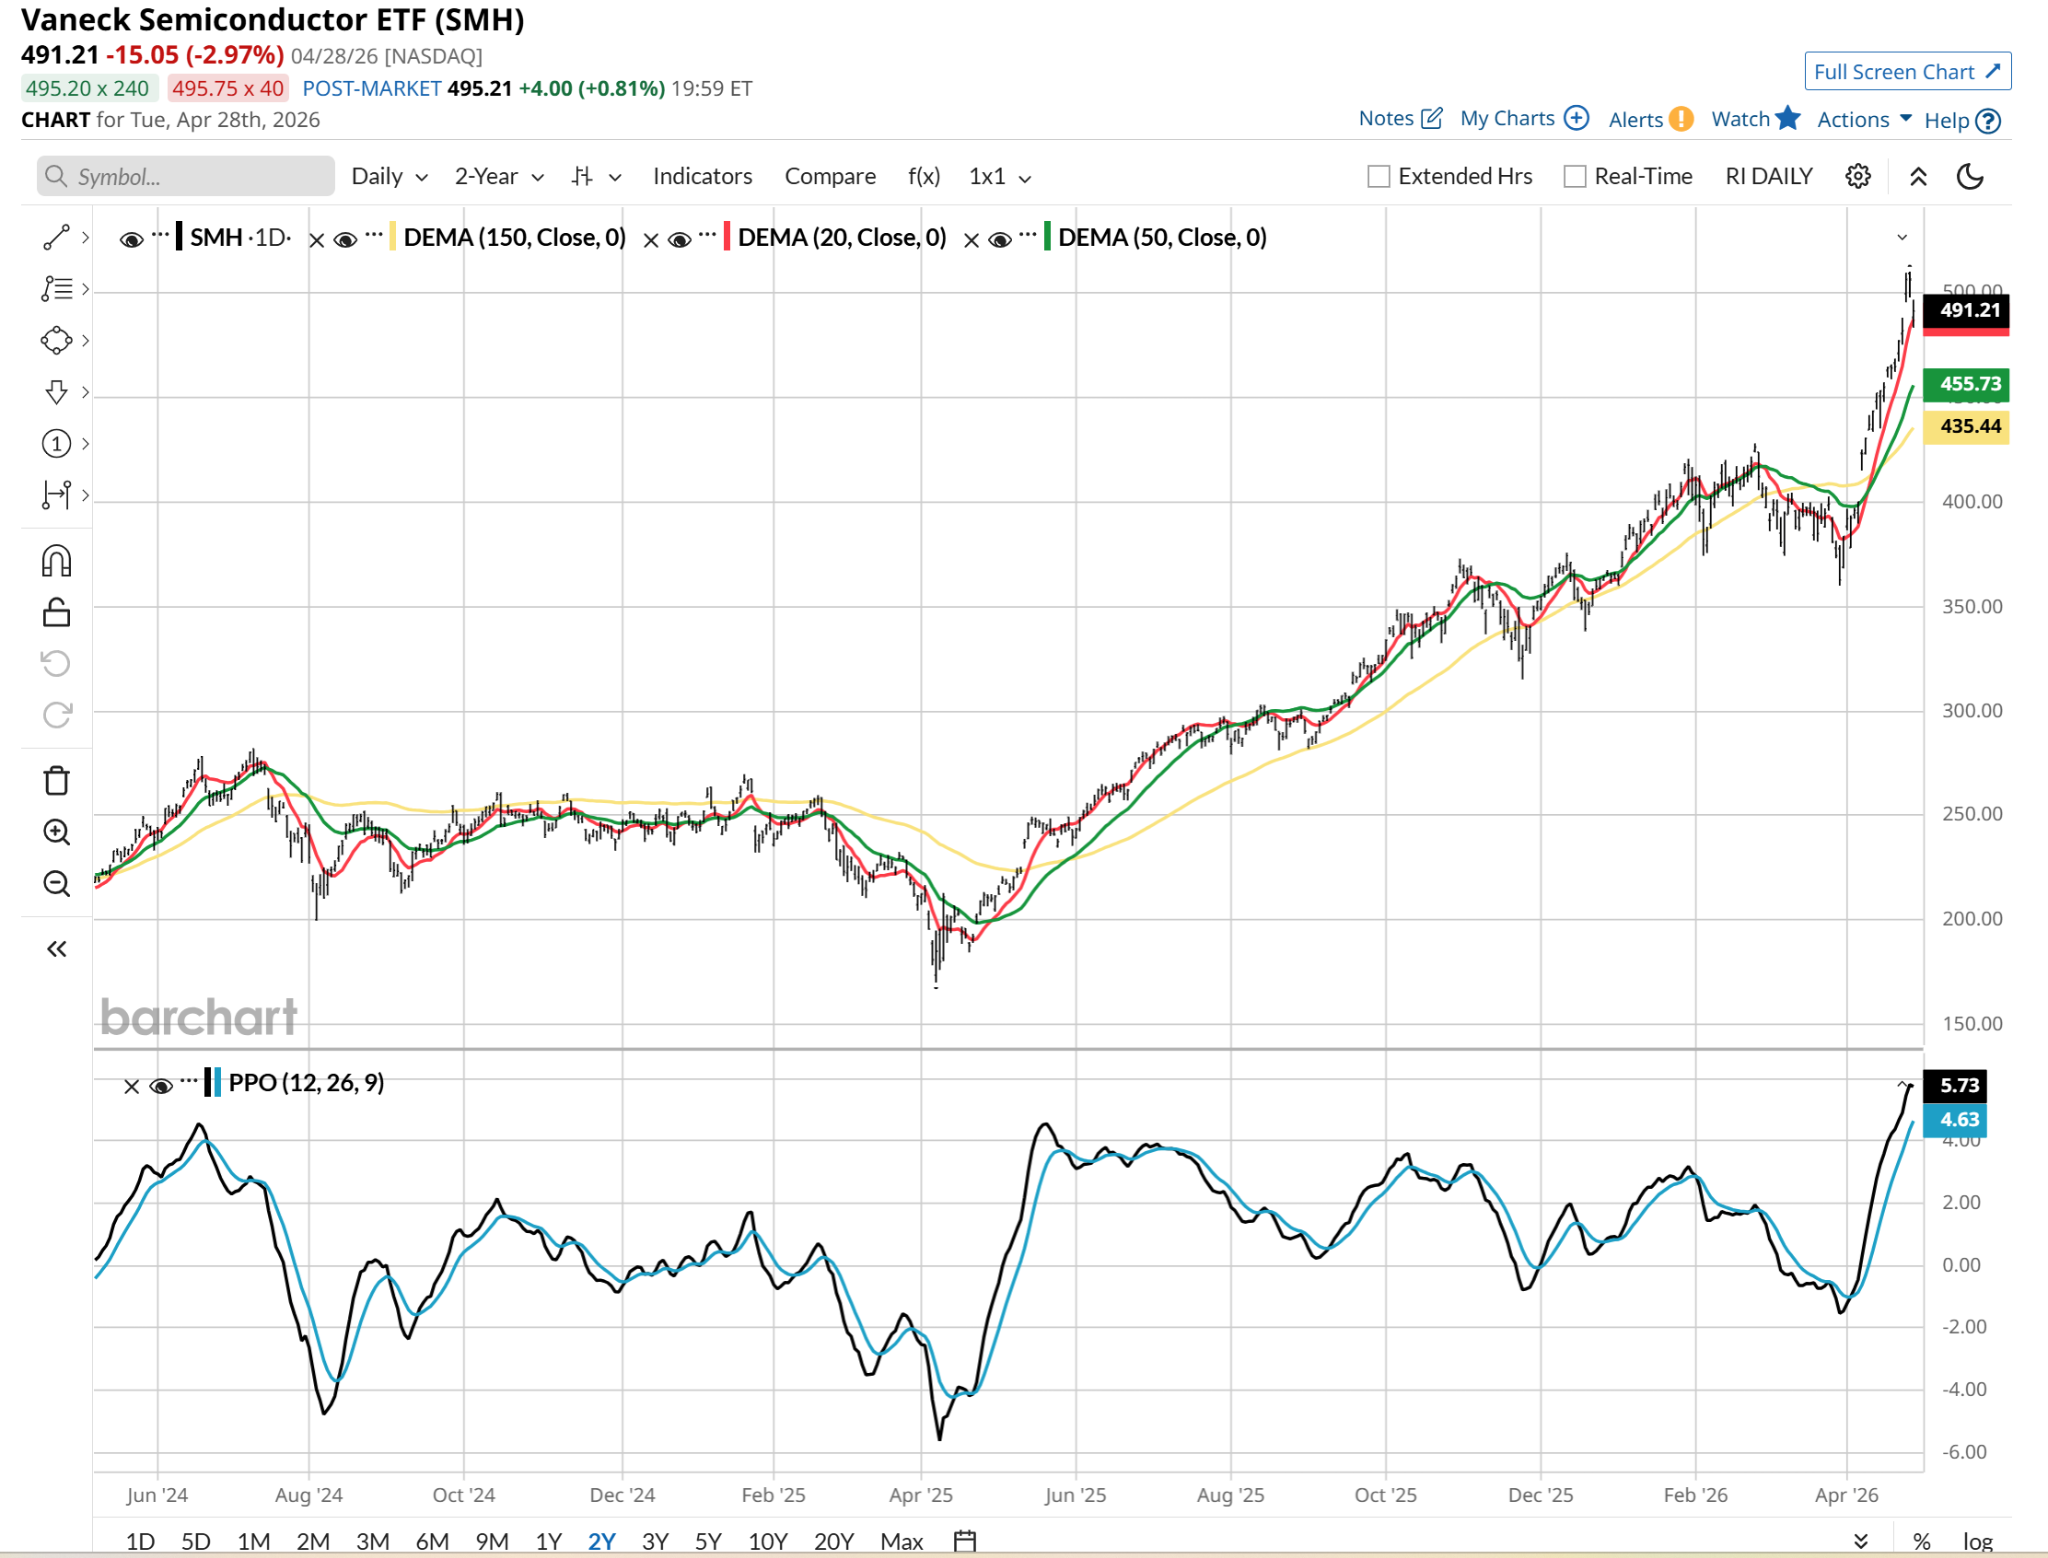
Technically speaking, ETFs like SMH have surged so high, even a quick 3% haircut on Tuesday doesn’t put a dent in the uptrend. A few more would be required to even start reversing the 20-day moving average. That said, the percentage price oscillator (PPO) at the bottom of the chart is anything but at the bottom. It is perched at its highest point in at least the past five years.
A quick ROAR Score analysis shows why I implore users of the tool I created to not look simply at the “spot” or current score, but the trend. Case in point, SMH here. 60 days ago a score of 20. That’s in the red zone, indicating a high return/high risk tradeoff, as the ETF had flattened out for months.
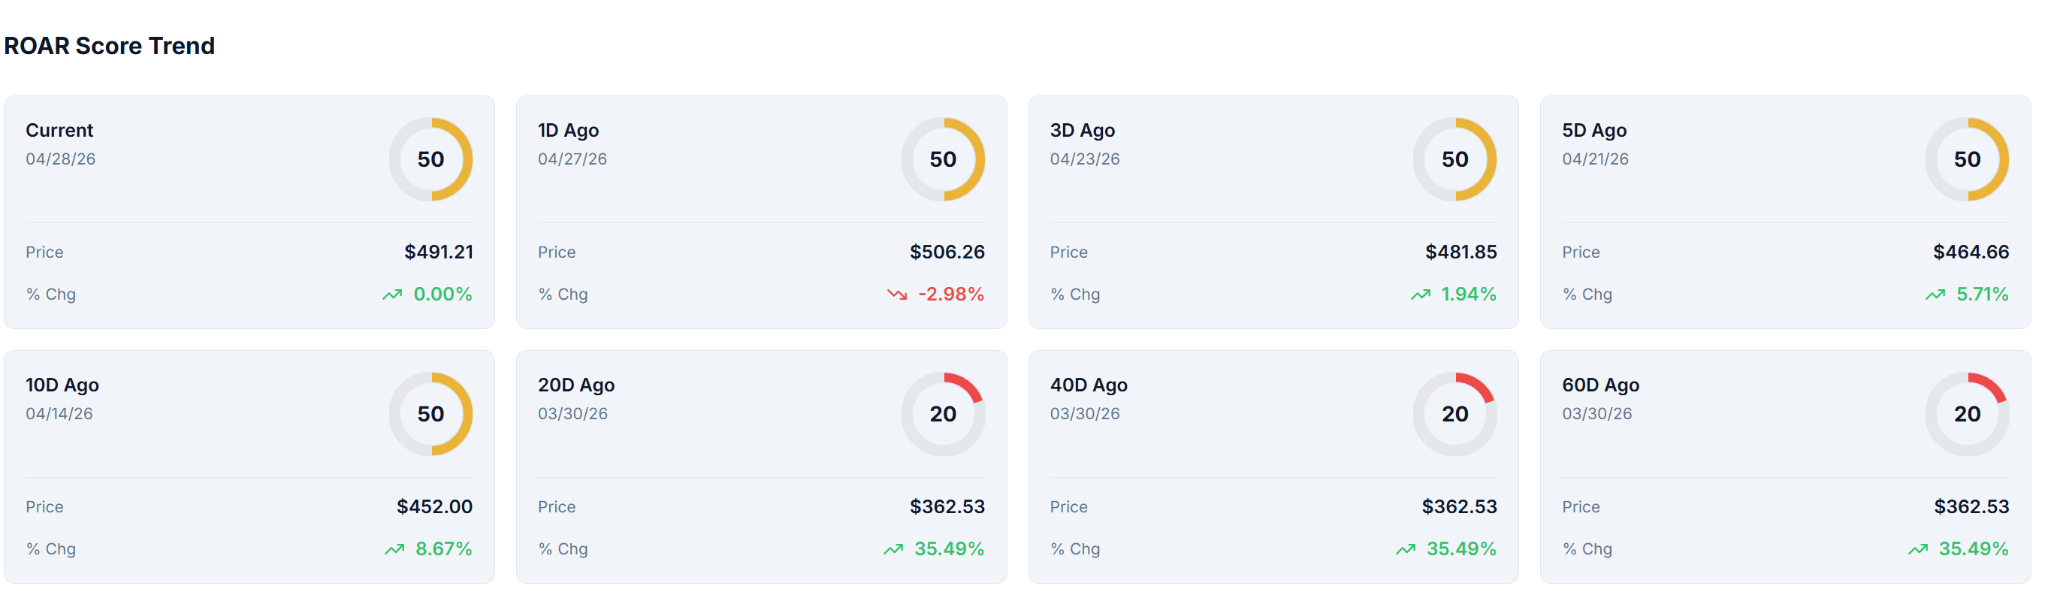
Then like a bat out of hell (intentional Meatloaf reference), SMH surged in price, up 35% in just the past 20 days. That coincided with the ROAR Score lifting off from that red zone, and turning yellow. Which is a good thing when it came from a red status.
But the move was so urgent to the upside that SMH essentially moved too fast to ever enter green, or lower risk, territory. So here it sits, perched up high, and still indicating that risk is at best neutral.
Bottom line: The middle of this year has suddenly alerted investors to the importance of managing concentration risk of a sector that has become too big to ignore, but too volatile to hold blindly.
The elephant is now firmly in the room. Whether you choose to ride it or hedge against its weight, ignoring the 14% concentration in semiconductors is no longer an option for DIY investors.
Rob Isbitts created the ROAR Score, based on his 40+ years of technical analysis experience. ROAR helps DIY investors manage risk and create their own portfolios. For Rob’s written research, check out ETFYourself.com.