Multiple factors suggest that gold prices could trade sideways towards the end of 2025, primarily due to the balancing act between decreased seasonal demand and offsetting economic uncertainties. A strong rally leading up to the Diwali festival has given way to profit-taking and a stronger U.S. dollar, which could temper future gains. However, persistent geopolitical risks and ongoing central bank accumulation should continue to provide a price floor, preventing a significant decline.
Factors that may cause gold prices to stabilize:
- Weakening post-Diwali demand: The end of the Indian festive season typically results in a sharp drop in physical gold demand. Since India is a major global consumer, this seasonal slowdown could apply downward pressure on prices through the year-end.
- A rebound in the U.S. dollar: A stronger U.S. dollar makes gold more expensive for buyers using foreign currencies, which can reduce international demand. Recent optimism surrounding U.S.-China trade talks has diminished safe-haven demand and contributed to a strengthening dollar, weighing on gold prices.
- Profit-taking after a rally: Gold reached all-time highs in October 2025 of $4,398 per ounce (December futures), driven by geopolitical concerns and expectations of U.S. rate cuts. Year-to-date, gold investors have enjoyed a 44% return. The recent correction reflects natural profit-booking by investors after this sustained rally, which could continue to limit upside potential in the near term.
- Fed policy and easing fears: The U.S. Federal Reserve is expected to cut rates, which generally supports gold prices. However, if the Fed's pace of cuts is not aggressive enough or if economic data improves, the resulting rise in real yields could lessen gold's appeal. Recent inflation data was slightly elevated, but in line with market expectations. This will allow investors to assess the Fed's future path better.
Continuing factors that may prevent a steep decline:
- Persistent geopolitical risks: Other global uncertainties remain despite easing trade tensions between the U.S. and China. The ongoing conflict in Ukraine and other areas of instability continue to drive intermittent demand for safe-haven assets like gold.
- Steady central bank buying: Central banks, particularly in emerging markets like India and China, have rapidly accumulated gold reserves. This institutional demand is a solid floor for gold prices, absorbing supply and supporting the overall market.
- Potential for rising inflation: While easing fears of inflation could cap gold's gains, the risk of persistent inflation remains. If economic data shows inflation stays longer than expected, gold's status as an inflation hedge could drive renewed interest.
- Investment uncertainty: Uncertainty over the U.S. government's fiscal health and potential trade policy shifts could continue to fuel safe-haven demand for gold. Volatility in bond and equity markets also makes gold an attractive structural hedge for many investors.
Technical picture
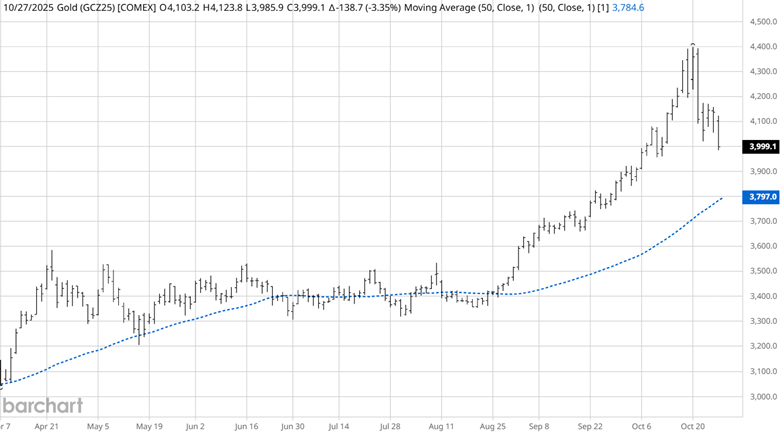
Source: Barchart
The December gold futures contract highlights the explosive move gold has had. During this bullish run, gold prices traded to extremes above their 50-day simple moving average (SMA). The current correction remains in the context of an uptrend. Profit taking was imminent, allowing investors to add to their bullish positions at lower prices. Gold prices have respected the 50 SMA in past declines and may find the same demand as it approaches the up-sloping SMA.
Gold market correlations
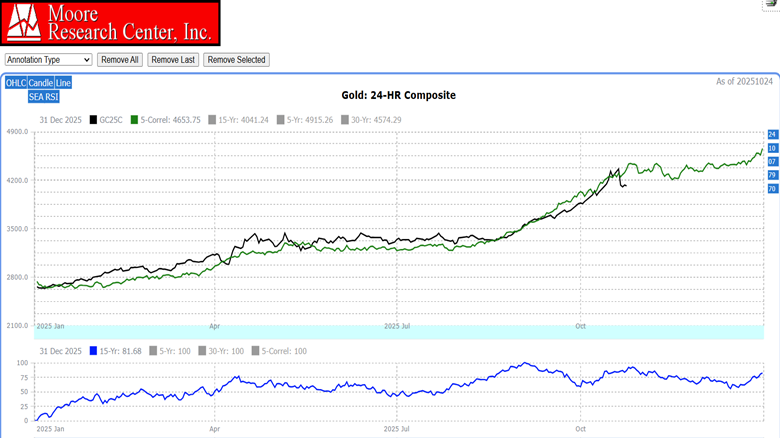
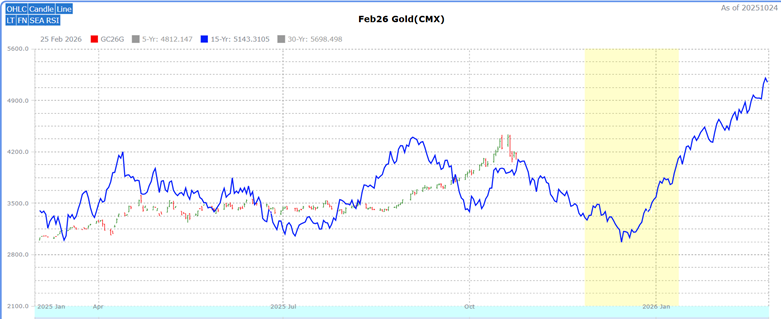
Source: Moore Research Center, Inc. (MRCI)
Cash gold prices (black) have been correlated (green) to 5 years of past price action: 1970, 1979, 2007, 2010, and 2024. As we advance, the correlations show that gold prices have topped out and have traded sideways into the last part of the year. The 15-year seasonal pattern (blue) shows that gold prices typically find a top in mid-September or mid-October. Then, for the remainder of the year, trade sideways before exploding higher near the 1st quarter of the following year.
Seasonal pattern
Source: MRCI
MRCI research has found that the next significant seasonal buying opportunity will be in November, but the move will be more pronounced after the first week of December. We will cover this pattern in more detail at that time.
Investors may want to delay purchasing gold until we get near this seasonal buying window.
As a crucial reminder, while seasonal patterns can provide valuable insights, they should not be the basis for trading decisions. Traders must consider various technical and fundamental indicators, risk management strategies, and market conditions to make informed and balanced trading decisions.
Assets to Participate in the Gold Market
In the past, futures traders could participate in these moves using the standard-size contract (GC) or the micro-size (GR) contract, and equity traders could use the exchange-traded fund (ETF) symbol (GLD). Additionally, investors could purchase physical gold in the spot market.
While the GR contract is more affordable than the GC for many traders, there has still been significant demand for a smaller gold contract from the retail trading base. To answer this request, the CME Group launched a 1-ounce gold futures contract on January 13, 2025, aimed at the retail client.
Specifications for the new gold contract are:
- Contract Size: 1 ounce
- Pricing: U.S. dollars and cents per ounce
- Tick size: $0.25 (note the GC and GR contracts are $0.10)
- Trading symbol: 1OZ
- Expiration months: Feb, Apr, Jun, Aug, Oct, & Dec
- Settlement method: Cash settled
The features of the 1OZ contract allow traders to track the price of gold more accurately. The 1OZ futures are directly tied to the spot price, offering accurate market exposure.
In closing…
Gold prices at the end of 2025 hinge on market correlations and seasonal patterns, as MRCI data shows. Historical trends from 1970, 1979, 2007, 2010, and 2024, alongside the 15-year seasonal pattern, indicate gold often trades flat after peaking in September or October. This points to a buying opportunity in November or early December. Factors like reduced demand after Diwali, a rising U.S. dollar, and profit-taking suggest price stabilization, while geopolitical tensions and central bank purchases support a price floor. Investors should weigh these patterns but rely on technical indicators, fundamental analysis, and risk management to make informed decisions in the gold market.