Statistics is an interesting branch of science that has often got a bad rap. It teaches us a lot about the world and helps us quantify things really well. Statistics also helps with planning, forecasting, and understanding different facts.
Although it provides many unique insights, people tend to spout numbers without truly understanding the context behind them. These misinterpreted stats can put you on the wrong path completely and change the narrative of a story. Which is exactly what you’ll find in the examples shared in this list.
More info: Reddit
#1

Image credits: Torvaun
#2

Image credits: _forum_mod
#3

Image credits: _forum_mod
A popular saying is that numbers don’t lie. But apparently, people do. It might seem like statistics is a branch of science that should not be argued with. But as it turns out, it is possible for people to exaggerate or misuse certain facts. According to Datapine, “Misleading statistics refers to the misuse of numerical data either intentionally or by error. The results provide deceiving information that creates false narratives around a topic. Misuse of statistics often happens in advertisements, politics, news, media, and others.”
Not only do regular people tell half-truths with stats, but it’s also professionals who sometimes muddy the waters. A shocking survey of scientists found that 33.7% of them had engaged in questionable research practices like changing the results of studies to improve outcomes, subjectively interpreting data, and holding back on certain analytical details.
#4

Image credits: Brainsonastick
#5
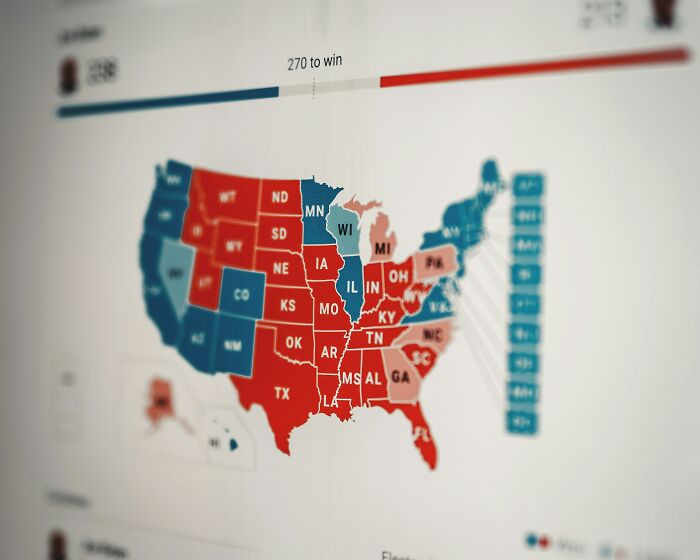
Image credits: IrianJaya
#6

Image credits: JoeMorgue
Bored Panda interviewed Professor Jennifer Visser-Rogers, the Vice President for Statistical Research and Consultancy, PHASTAR, to understand a bit more about statistics and why people misuse them. Here’s what she shared: “A statistic on its own is just a number. It’s the context that tells the story, but unfortunately, this can result in a misleading story if the context is inaccurate.”
People also tend to fall prey to the issue of sample sizes. For example, let’s say there’s a survey wherein 60% of the respondents preferred Version A over Version B. Obviously, you’d imagine that Version A was the superior option. If the number of people surveyed were 10,000, that would be a pretty significant sample size to back up the research. But if you found out that the number of people surveyed was only 20, then it would mean that just 12 people preferred Version A. That’s why the context behind the statistic matters.
#7

Image credits: pm-p**sy4kindwords
#8

Image credits: Dutchess_of_Dimples
#9

Image credits: dasssitmane
Jennifer provided an example to explain how people should interpret statistical data. She said: “So, for example, if I tell you that eating bacon every day increases your risk of pancreatic cancer by 20%, that’s quite a shocking figure. But what does that 20% increase even mean? It’s a relative risk, which tells me what the risk is in one group compared to another. But it doesn't tell me anything about what my risk actually is.”
“If I were to tell you that we have a 1 in 80 lifetime risk of pancreatic cancer, that means that out of 400 people who don't eat bacon, we would expect 5 of them to get pancreatic cancer anyway. A 20% increase in this means that if you took 400 people who ate bacon every day, we would expect 6 of them to get pancreatic cancer. So only an extra 1 person in every 400. Which doesn't sound anywhere near as shocking as a 20% increase,” she added.
#10

Image credits: c3534l
#11

Image credits: Bella1904
#12

Image credits: greeneyedwench
Another fascinating example Jennifer shared illustrated how easily information could be manipulated to make a statistic seem more appealing. In fact, many brands and companies might use this tactic, which is why people should start paying more attention.
She stated, “One of my favorite stories is that Colgate came under fire for one of its advertising campaigns that stated that ‘80% of dentists recommend Colgate.’ It was reported for being misleading and suggesting that this meant dentists recommend Colgate over other brands. But that wasn’t how the data was collected, dentists were told to recommend several toothpaste brands, so it wasn’t that 80% recommended Colgate and 20% recommended other brands,” she added.
#13

Image credits: offbrandbarbie
#14

Image credits: Candersx
#15
Image credits: MatthewHecht
An interesting phenomenon in the world of statistics is the Simpsons Paradox (not based on the show). It shows how oversimplification of data can cause people to come to dangerous conclusions and why a healthy bit of skepticism is important. A popular example of this is when UC Berkley feared they would face a lawsuit for gender bias because they admitted fewer female applicants in one year. However, a statistician found that upon dividing the school into departments, there was gender bias in favor of women for 4 out of the 6 departments and no significant gender bias in the remaining 2.
#16

Image credits: SubmissiveDinosaur
#17

Image credits: robjapan
#18

Image credits: Bross93
Apart from sample sizes and people cherry-picking stats, Jennifer also shared that “Another thing that people often get wrong is the difference between percentages and percentage points. If, say, inflation goes from 4% to 9%, this doesn't mean that is has increased by 5%, it has gone up 5 percentage points. It’s a really subtle difference but with completely different meanings. But I get that concepts like this can be really difficult for people to get their heads around.”
“We are bombarded with data and statistics now on a daily basis, so I think it’s really important for us all to have a certain level of critical thought to challenge what we see. If we’re expected to use statistics to make decisions about our day-to-day lives, it’s really important to understand what questions we need to ask to be able to fully understand the context of what we’re being presented with,” she added.
#19

Image credits: Charr49
#20

Image credits: Warp-10-Lizard
#21

Image credits: TwinkleTwinkleBaby
With so many examples of statistical manipulation or misunderstanding, it can be tough for people to understand what to actually believe. That’s why Jennifer shared a few questions that we could ask ourselves when faced with a new statistic:
- In what population/country/year was this statistic collected, and how generalizable is it to what I’m interested in?
- Who are the people surveyed to get this statistic, and do they have a vested interest in it?
- What is the uncertainty on any figure that you see?
- What do the numbers even mean?
#22

Image credits: ferocitanium
#23

Image credits: Redlum13
#24

Image credits: Valuable_Anywhere_24
Stats will only present the facts of the matter, but it is up to us to sift through the data and question the information before us. That’s the only way that we won’t get swept up in baseless assumptions. People are tired of others using stats mindlessly without considering the context, which is why this post got 1.6k upvotes and so many interesting comments. Which misunderstood statistic were you most shocked by in this list? Tell us in the comments, and share any examples that you’ve come across.
#25

Image credits: Ok-Camera-1979
#26
Image credits: EntrepreneurOk7513
#27

Image credits: Privateaccount84
#28

Image credits: SlowBat9250
That the average lifespan a few hundred years ago was close to 40. That's heavily skewed by child mortality, and if you made it to 10, you were probably going to make it at least to 60.You're most likely to get in an accident near your home.
Well, obviously that's where statistically most likely to be in terms of frequency. I wonder what the stats would be after adjusting for that.I've heard a "certain segment" of people who like to cite crime statistics say "there are more black men in prison than in college."
You're comparing approximately a range of 4 to 5 years (college) to a life time (prison).The number of “border encounters”. It gets touted by the media all the time and people treat it like a measure of illegal border crossings but it’s not.
For one thing, if you drop enforcement to zero, border encounters go to zero too while crossings go up. Similarly, if you have more effective enforcement, the number of encounters goes up.
For another, researchers found that about half of all border encounters were with people who had attempted to cross before and were sent back. So it’s reflective of the number of tries more than the number of people.
Then there’s the fact that it counts asylum seekers, who are crossing entirely legally. In fact, the recent spike in border crossings is largely due to a spike in asylum seekers.
But people treat it like the number itself means something, especially the change in it, but it’s a measure of a combination of things and you can’t draw conclusions about any one of them from that number alone.Election maps where 90% of the state is colored by one party to include vast areas of wilderness and unpopulated regions to skew the perception that their party is much more popular than the other, while conveniently ignoring the fact that most people live in densely populated areas.Population density. 99% of "OMG LOOK AT THIS MAP AND LOOK WHERE ALL THE BAD THINGS ARE HAPPENING" hot takes are just maps of "Where most people live.".Pretty much all statistical facts.
as a stats guy te more you work with numbers the more you realise the only person who really has a proper understanding of what they're showing is the person who did the study themselves.As a statistician (*pushes glasses up nose*) 89% of statistical facts are thrown around without sufficient context (Me, 2024). Even in academics/literature. Statistics are used all the time to confirm a specific view point/hypothesis with complete disregard for how the information was collected, what it means, and how it relates to the real world.
Phone surveys only include people who answer their phone when unknown numbers call. Mail surveys are only responded to by people conscientious enough to fill out the survey. Most surveys get such low response rates that calling it "representative of the population" is absolutely laughable. Self report surveys are usually skewed by people giving answers they think the org giving the survey wants to hear.I’m doing X fad diet (keto, vegan, carnivore, extended fasting, omad, etc) and lost Y lbs in only Z weeks! ???
Half of it was water/muscle/poop, soon enough you’re going straight back to your old habits.> urine is sterile
Yeah, while its still in your bladder. Once it hits your urethra its not f*****g sterile anymore.“Tons of people heard Kitty Genovese being killed but nobody called 911”
Yeah, because 911 didn’t exist in 1964.If there's a name for this phenomenon, let me know, because I see it a lot. Using a statistic backward to be misleading.
A relatively apolitical example: "90% of all women millionaires made their fortune in MLMs!"
Nope. It's that *of people who made a million in MLMs*, 90% of them were women.
I've seen it other places too. Another one floating around is that 75% of lesbian married couples divorce, when it's actually that *of same-sex divorces*, 75% are F/F, in part because more F/F couples marry to begin with.That women almost always get the kids in divorce
This is true, but that’s because 90% of child custody cases are settled on outside of court, meaning the fathers aren’t actually fighting for custody of the kids. When they do they usually do get joint custody so long as the father is a fit parent.The statistic about you being attacked by a shark in the United States. A lot of times they'll just use the entire population of the country. I'm sorry but if you're in Kansas it's functionally zero percent vs an active surfer/swimmer in the ocean on the coast.They always get mean mistaken for median.That one about we using only a fraction of our brain.More people die from drowning after eating ice cream.
Context is that most people eat ice cream near the sea or at pools on holiday.The people who throw out that black individuals are statistically more likely to commit crimes. That may be the case looking at pure numbers, but they also never recognize that the locations these happen in have extremely poor standards of living. Low income necessitates crime, and people know that, yet they gleefully push people into these situations so they can have more for their stats.Just about any headline that states "if you eat X you are twice as likely to die from Y." The context is that Y is usually a rare condition such that the case rate goes from 3/100,000 to 6/100,000 people. Yeah, it doubled but so what? The odds are in your favor so if X is your fav food go ahead and enjoy it."Chihuahuas attack more people than pitbulls do, but the media only reports it when it'sa pitbull."
I imagine iguanas bite more people than alligators do, but for some reason the media cares more when a gator does it. Maybe because of the amount of damage it can cause.You used to see a ton of this from climate deniers - "There has been no warming in the last X years". Where X is however many years it was since 1997, which was an unseasonably warm El Nino year. The trend has been warmer and warmer for decades, but for a long time after 1997 the trend sort of looked flat if you only went back to this one outlier. We might see more of this starting from 2024.You’re part of only the less than 1% that serve in the military. Usually told in speeches at basic training and academy graduations.
That number is true if you look at currently serving vs. total population. But if you consider everyone alive who HAS served in that number, it’s around 7%. If you consider the number of kids who will eventually serve, it’s over 10%. Then if you factor in the number who would choose to but aren’t eligible, the number that would have but couldn’t in the past due to discrimination, it’s probably much higher than that.
But the 1% number gets spouted a lot so veterans get to feel extra special.
(US based statistics only).On average, everyone on the planet has one testicle.The current inflation of the U.S, usually disregarding the fact that it's worldwide.That 15 minutes might save you 15% or more on car insurance.Just remember
‘Liars can figure, figures can lie’
Think around the stats.The gender pay gap doesn’t take into account hours worked, or different kinds of work. More women just work part time.
When you compare salaries between men and women without children, the difference drops to 3%. Not perfect, but nowhere near the amount people think it is.That women make 70% percent of what a man makes. People often miss the crucial context that the stat does not compare what jobs people have. When you compare men and women who are in the same job, the 'gender wage gap' practically disappears. (Which makes since cause it is illegal to pay someone less based on their gender).