/Palo%20Alto%20Networks%20Inc%20HQ%20sign-by%20Sundry%20Photography%20via%20Shutterstock.jpg)
Palo Alto Networks (PANW) reported adjusted free cash flow (FCF) in its fiscal Q2 that was up 27% year-over-year. Moreover, on a trailing 12-month basis, adj. FCF was 37.9% of sales, up from 34.4% a year ago. As a result, its value is significantly higher than today's price.
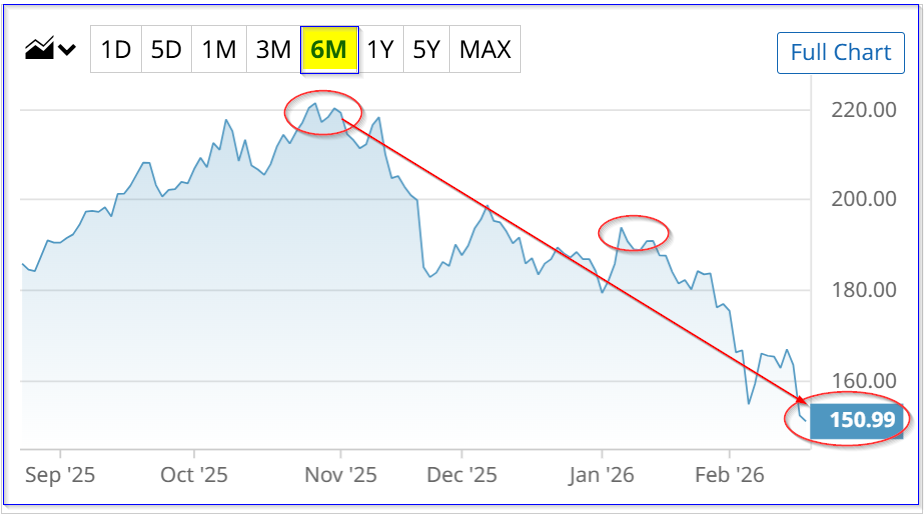
PANW closed at $150.99 on Thursday, Feb. 19, down from its recent peak of $163.50 on Feb. 17, when its fiscal Q2 ended January 31, 2026. PANW stock is now down $70.39, or -31.8% from its peak of $221.38 on Oct. 28, 2025.
This downfall may have gone too far, especially given its strong results and management's good outlook guidance. For example, has Palo Alto Networks, Inc. really lost almost ⅓ of its underlying true value, as its stock price's drop seems to indicate?
It doesn't seem so, as a reasonable target price based on its FCF margins is $187, or over 24% higher than today's price. This article will show why.
Strong FCF and FCF Margin Results
Palo Alto Networks, a global leader in AI cybersecurity solutions, with over 70,000 clients, makes most of its revenue from SaaS subscriptions. They tend to renew once a year, and it books most of that cash flow in Q1.
As a result, it makes sense to review the company's results on a trailing 12-month (TTM) basis to iron out quarterly lumps.
So, for example, for its fiscal Q2 ending Jan. 31, 2026, Palo Alto Networks generated $3.747 billion in adjusted TTM FCF. That compared to $2.952 billion in the TTM period a year ago, a gain of +27.4% YoY.
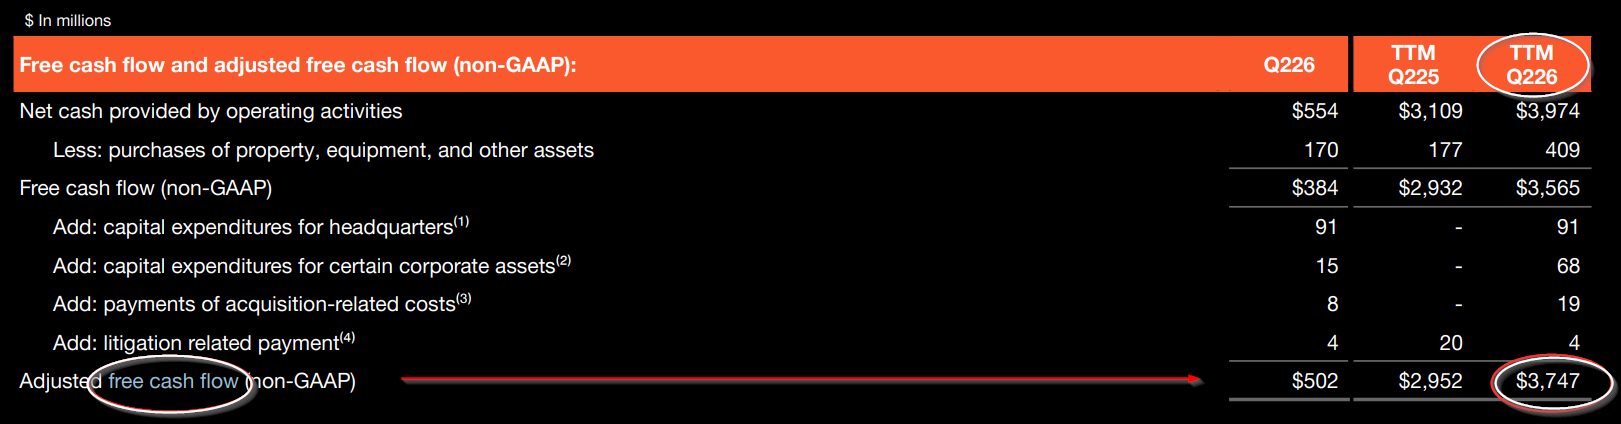
That TTM FCF also represented 37.9% of its TTM revenue of $9.894 billion (TTM revenue taken from Stock Analysis).
Not only is that a higher adj. FCF margin than a year ago ($2.952b/$8.570b, or 34.4%), but it's also below management's guidance for 2026.
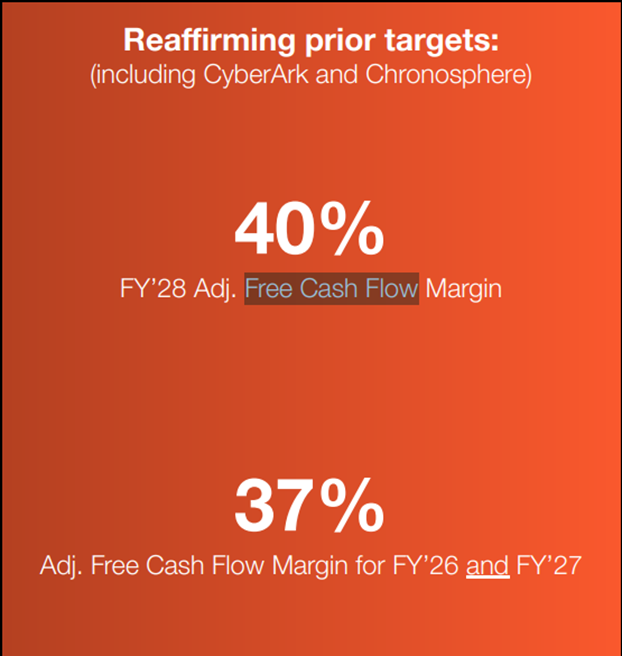
For example, on page 16 of the Feb. 17, 2026, earnings release deck, management has a slide showing they expect the next 2 years to have a 37% margin, eventually rising to 40%:
So, if Palo Alto can continue to make 38% in trailing 12-month (TTM) adjusted FCF margins, it will outperform management's guidance. That should lead to a higher target price (TP).
Forecasting Higher FCF
For example, management projects that revenue for this fiscal year ending July 31 will be between $11.28 billion and $11.31 billion, or $11.30 billion on average. And analysts are forecasting $13.56 billion in revenue next year.
So, for the next 12 months (NTM), revenue could reach $12.43 billion.
So, if Palo Alto Networks can make at least a 37% adjusted FCF margin, based on management's guidance, its FCF could rise 23%. Here's why:
$12.43 billion NTM revenue x 37% = $4.6 billion NTM FCF
$4.6b / $3.7475b TTM FCF = 1.2276 -1 = +22.8%
That implies that its target price could be 23% higher. Let's look at that.
Target Prices for PANW Stock
One way to value a company based on its free cash flow (FCF) is to see what the dividend yield would be if its FCF was 100% paid out to shareholders.
So, for example, PANW now has a market cap of $122 billion, according to Yahoo! Finance. So, its TTM FCF yield is about 3.0%.
$3.747b TTM FCF Q2 / $122 billion = 0.0307 = 3.07%
That implies the market would give PANW stock a 3.0% dividend yield if 100% of FCF were to be paid out as a dividend.
So, let's apply that to our NTM forecast:
$4.6 NTM FCF / 0.03 = $153.33 billion market cap
That is +25.6% higher than its present market cap of $122 billion. In other words, PANW stock could be worth 25.6% more:
$1150.99 x 1.256 = $189.64 target price (TP)
That TP is 25.6% higher than today's price.
Other analysts agree that PANW is undervalued. For example, Yahoo! Finance reports that 56 analysts have an average TP of $210.59. Similarly, Barchart's mean survey TP is $222.51.
AnaChart.com, which tracks recent analysts' write-ups, shows that 36 analysts now have an average PT of $193.36. That is 28% higher than Thursday's close.
The bottom line is that PANW stock is too cheap here. I will show several ways to play this in a future Barchart article.