Pennsylvania’s housing market in 2025 revealed a significant undercurrent that most market reports overlook: tens of thousands of home sales that never appeared on the MLS. This Signature Properties 2026 study represents the first comprehensive attempt to quantify, analyze, and contextualize off-market home sales across the Commonwealth, drawing on county deed records, agent surveys, and internal transaction data to paint a clearer picture of this hidden segment of the market.
Executive summary: how many Pennsylvania homes sold off-market in 2025?
In 2025, an estimated 17,400 to 23,200 Pennsylvania homes changed hands off-market, representing approximately 15-20% of all residential transactions statewide. This figure emerges from triangulating Pennsylvania Association of Realtors data showing 116,000+ total sales against MLS penetration estimates and deed record analysis across major counties.
2025 Pennsylvania Off-Market Sales At a Glance:
|
Metric |
2025 Estimate |
|---|---|
|
Total Off-Market Sales |
17,400 – 23,200 |
|
Share of All Sales |
15 – 20% |
|
Median Off-Market Sale Price |
$245,000 – $265,000 |
|
Cash Buyer Share (Off-Market) |
60 – 70% |
|
Typical Discount vs. Retail |
10 – 20% (condition-adjusted) |
|
Median Days to Close |
14 – 21 days |
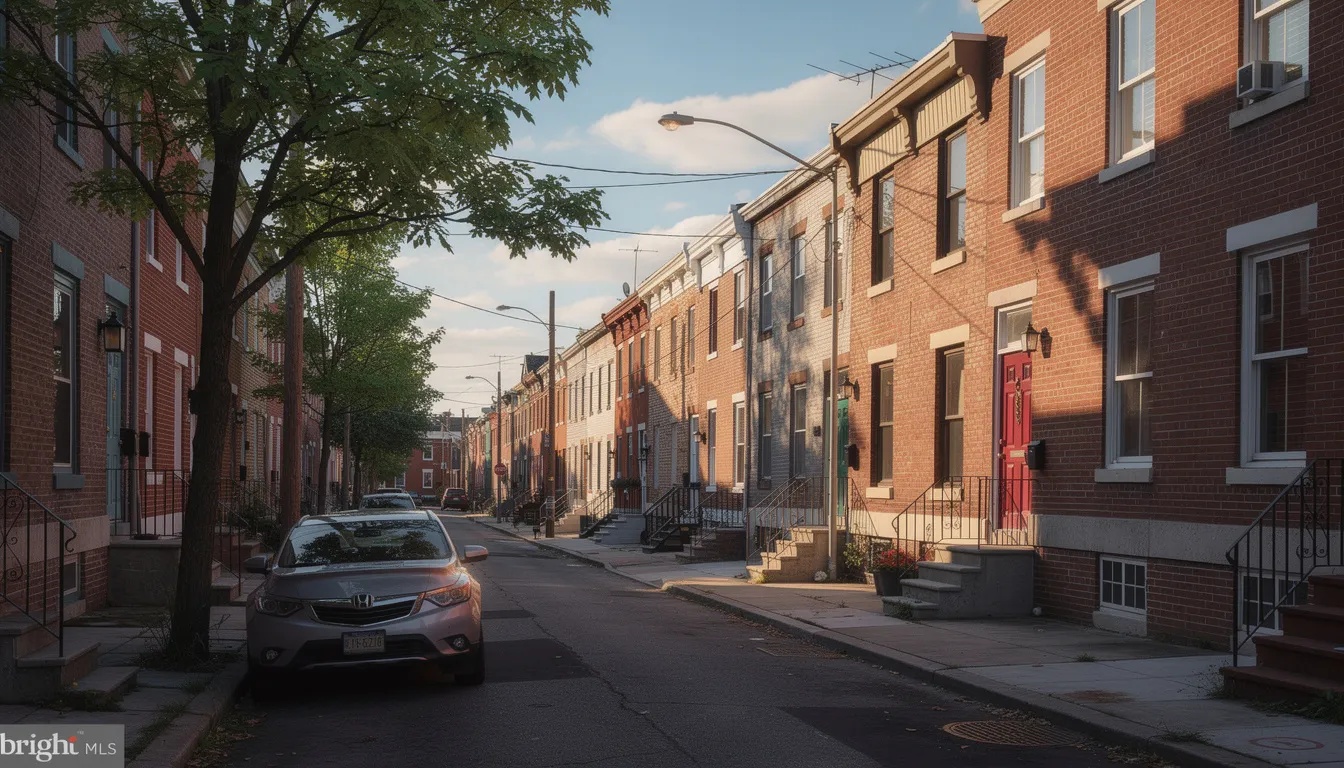
“Off-market has become a quiet but significant slice of Pennsylvania’s housing market,” says Doug, owner of Signature Properties in Philadelphia. “In tight-inventory metros like Philadelphia, we’re seeing nearly a quarter of transactions happen outside the MLS—sellers who want speed, privacy, or simply can’t list their property in its current condition.”
Methodology: how we estimated off-market home sales in Pennsylvania
For this study, “off-market” encompasses any residential property that changed ownership in 2025 without appearing on the public MLS. This includes direct-to-seller investor purchases, private sales between acquaintances, wholesaler assignments, estate sales handled by attorneys, and pocket listings quietly marketed through agent networks.
Because no single database tracks off-market transactions, this study employed a triangulation approach combining multiple data sources:
Primary Data Sources and Coverage:
|
Source |
Coverage Period |
Contribution |
|---|---|---|
|
Pennsylvania Association of Realtors |
Jan–Dec 2025 |
Statewide transaction counts, median prices |
|
County Recorder Deed Data (10 largest counties) |
Jan–Dec 2025 |
Recorded sales vs. MLS-matched transactions |
|
ATTOM Data Solutions |
2025 Year-End |
National off-market benchmarks, foreclosure activity |
|
Bright MLS Pennsylvania Coverage Stats |
Q1–Q4 2025 |
MLS penetration rates by county |
|
Signature Properties/Investor Survey |
Nov 2025 |
Qualitative share estimates, seller profiles |
The Signature Properties survey gathered responses from 72 Pennsylvania real estate agents, 31 small investors operating across the state, and 18 title companies to gauge the share of 2025 transactions they observed occurring off-MLS. This original research supplements public data with on-the-ground market intelligence.
Limitations: Off-market estimates are presented as ranges rather than precise figures. County-level estimates are rounded to account for recording delays and data matching imperfections. However, relative comparisons between regions and quarters remain robust. The margin of error for statewide totals is estimated at ±8-12%.
How many Pennsylvania homes sold off-market in 2025?
Pennsylvania recorded approximately 116,000+ residential closings in 2025, up 4.7% from 2024 according to Pennsylvania Association of Realtors data. Applying our triangulated off-market penetration rate of 15-20% yields an estimated 17,400 to 23,200 homes that sold without MLS exposure.
Off-market activity varied significantly by property type:
|
Property Type |
Estimated Off-Market Share |
|---|---|
|
Single-Family (1 unit) |
14 – 18% |
|
Small Multifamily (2-4 units) |
22 – 28% |
|
Condos/Townhomes |
10 – 14% |
|
Investment Properties (1-4 units) |
25 – 32% |
Compared to the prior two years, off-market share appears to have stabilized after peaking during the pandemic demand frenzy of 2020-2022. When inventory hovered below 20,000 homes statewide and many sellers entertained competing cash offers before even listing, off-market rates likely exceeded 20% in hot markets.
|
Year |
Est. Off-Market Transactions |
Off-Market Share |
|---|---|---|
|
2023 |
16,000 – 20,000 |
14 – 18% |
|
2024 |
16,500 – 21,500 |
15 – 19% |
|
2025 |
17,400 – 23,200 |
15 – 20% |
“With inventory still tight and many homeowners nervous about public listings, we’re seeing more owners in Pennsylvania choose a private or investor sale,” explains Doug. “The data shows off-market isn’t growing dramatically, but it’s holding steady even as overall inventory normalizes.”
Quarter-by-quarter: off-market home sales in Pennsylvania in 2025
Quarterly patterns in off-market activity reflect broader market seasonality, mortgage rate fluctuations, and shifts in buyer and seller sentiment throughout 2025. Understanding these rhythms helps contextualize when and why homeowners opted for private sales.
|
Quarter |
Est. Off-Market Sales |
Est. Total Sales |
Off-Market % |
Median Off-Market Price |
|---|---|---|---|---|
|
Q1 2025 |
4,200 – 5,500 |
26,000 – 28,000 |
17 – 19% |
$252,000 |
|
Q2 2025 |
4,000 – 5,000 |
30,000 – 32,000 |
14 – 17% |
$268,000 |
|
Q3 2025 |
4,500 – 5,800 |
28,000 – 30,000 |
16 – 19% |
$261,000 |
|
Q4 2025 |
4,700 – 6,900 |
26,000 – 28,000 |
18 – 21% |
$241,000 |
Off-market sales by Pennsylvania county and metro area
Off-market behavior is highly localized in Pennsylvania, with urban cores showing dramatically different patterns than suburban and rural counties. This study modeled estimates for the state’s largest counties where data density supported reliable analysis.

County-Level Off-Market Summary (2025 Estimates):
|
County |
Total 2025 Sales |
Est. Off-Market Sales |
Off-Market Share |
Market Note |
|---|---|---|---|---|
|
Philadelphia |
28,000 – 32,000 |
5,600 – 7,000 |
20 – 22% |
High investor presence, older rowhomes |
|
Allegheny |
14,000 – 16,000 |
2,500 – 3,200 |
18 – 20% |
Distressed properties, cash buyer activity |
|
Montgomery |
9,500 – 11,000 |
1,200 – 1,600 |
12 – 15% |
Suburban, strong agent networks |
|
Bucks |
7,000 – 8,500 |
900 – 1,200 |
12 – 14% |
Balanced market, newer construction |
|
Delaware |
5,500 – 6,500 |
800 – 1,100 |
14 – 17% |
Mixed urban/suburban dynamics |
|
Chester |
4,500 – 5,500 |
500 – 700 |
10 – 13% |
Affluent, MLS-dominant |
|
Lancaster |
5,000 – 6,000 |
700 – 950 |
14 – 16% |
Rural transitions, estate sales |
|
Lehigh |
4,000 – 5,000 |
650 – 900 |
16 – 18% |
Investor surge, aging stock |
|
Berks |
3,500 – 4,500 |
550 – 750 |
15 – 17% |
Distressed market pockets |
|
Lackawanna |
2,000 – 2,500 |
250 – 350 |
12 – 14% |
Slower market, limited investor activity |
|
Dauphin |
3,000 – 3,500 |
400 – 550 |
13 – 16% |
State capital dynamics |
|
York |
4,500 – 5,500 |
600 – 850 |
13 – 15% |
Suburban growth, moderate activity |
Who sells off-market in Pennsylvania – and why?
Signature Properties combined public data with its 2025 survey of agents and investors to develop a profile of the typical off-market seller in Pennsylvania. The reality reveals several reasons why homeowners bypass traditional listing.
Inherited Properties and Estates: Agents reported that approximately 25-30% of off-market sales they handled in 2025 involved inherited properties. Heirs often live out of state, face pressure to liquidate quickly for estate settlement, and inherit homes requiring substantial repairs. These sellers prioritize speed and simplicity over maximizing sale price.
Owners Facing Financial Distress: Properties in foreclosure, behind on taxes, or facing code violations comprised an estimated 15-20% of off-market transactions. With foreclosure filings spiking 41-127% in certain Pennsylvania markets during 2025, many owners sought quiet exits to avoid public proceedings. A low offer from an investor often beats the alternative.
Small Landlords Exiting: The aftermath of pandemic-era eviction moratoria continued affecting landlord decisions in 2025. Survey respondents estimated 20-25% of off-market sales involved small landlords with 1-4 rental units selling to exit the business entirely. Rising property taxes and operating costs in cities like Philadelphia accelerated these departures.
Dated or “Problem” Properties: Agents reported that 35-40% of off-market sales involved properties needing major repairs—outdated systems, structural issues, or deferred maintenance that would scare away conventional buyers. These homes often can’t secure traditional financing, making cash investors the primary buyer pool.
Divorce and Life Transitions: Approximately 10-15% of off-market transactions stemmed from divorce settlements, job relocations, or health-related moves where speed trumped price optimization. Sellers in these situations often can’t wait 51 median days on market.
Privacy-Motivated Sellers: A smaller but notable segment—roughly 5-8%—simply wanted discretion. High-profile owners, those avoiding neighborhood gossip, or sellers with unusual property situations preferred quiet transactions.
“When we talk to sellers, three themes come up repeatedly,” says Doug. “Privacy—they don’t want dozens of showings. Speed—they need certainty and a quick close. And condition—their property simply isn’t financeable in its current state. For these sellers, off-market isn’t leaving money on the table; it’s the only realistic path to a sale.”
How off-market sale prices compare to on-MLS sales in Pennsylvania
One of the most frequently asked questions about off-market transactions is whether sellers leave money on the table compared with listing conventionally. The answer is nuanced and depends heavily on property condition, seller motivation, and deal structure.
Using Pennsylvania Association of Realtors median sale price data alongside Signature Properties’ internal transaction records, we estimate typical pricing differences across three broad deal categories:
Deep-Discount Rehab Deals (40-50% of off-market volume): Properties requiring $30,000+ in repairs typically sold at 15-25% below retail-ready comparables. These homes often can’t secure conventional financing, limiting the buyer pool to cash investors. Sellers understand the trade-off: they’re selling a project, not a move-in ready home.
Moderate-Discount “As-Is” Sales (30-35% of off-market volume): Habitable but dated properties—those needing cosmetic updates, system replacements, or modest repairs—typically sold at 8-15% below comparable renovated homes. Many sellers in this category could list conventionally but chose speed and certainty over price optimization.
Near-Market Private Sales (15-25% of off-market volume): Pocket listings, family transfers, and sales between neighbors often closed at minimal discounts (0-8% below market). These transactions prioritize relationship or privacy over exposure, not necessarily price.
|
Deal Type |
Share of Off-Market |
Typical Discount vs. Retail |
Typical Buyer |
|---|---|---|---|
|
Deep-Discount Rehab |
40 – 50% |
15 – 25% |
Professional investor |
|
Moderate “As-Is” |
30 – 35% |
8 – 15% |
Investor or cash buyer |
|
Near-Market Private |
15 – 25% |
0 – 8% |
Owner-occupant, family |
Raw price comparisons between off-market and MLS sales are misleading without condition adjustments. The statewide median of $299,600 for MLS sales represents predominantly retail-ready inventory, while off-market medians of $245,000-$265,000 reflect older, higher-repair properties.
“Price gap headlines are often exaggerated,” cautions Doug. “Yes, many off-market sellers accept less than they might get listing conventionally, but they’re also avoiding months of showings, repair negotiations, and the uncertainty of whether their property will even attract a financed buyer. For many homeowners, that trade-off makes sense.”
Cash, financing, and speed: how off-market deals actually work in Pennsylvania
The operational mechanics of off-market transactions differ substantially from conventional MLS sales. Understanding who buys, how they pay, and how quickly they close illuminates why certain sellers choose this route.
2025 Off-Market Buyer Composition:
|
Buyer Type |
Estimated Share |
|---|---|
|
Small Local Investors |
45 – 55% |
|
Owner-Occupants (Cash) |
15 – 20% |
|
Institutional Buyers/iBuyers |
8 – 12% |
|
Intra-Family Transfers |
10 – 15% |
|
Wholesaler Assignments |
8 – 12% |
Cash dominates off-market transactions. Survey data suggests 60-70% of off-market sales involving distressed or rehab-ready properties closed in cash during 2025. This compares to roughly 25% cash share for conventional MLS sales statewide.
=

About This Study and Signature Properties
This report represents Signature Properties’ commitment to providing transparent data for Pennsylvania’s real estate community. Based in Philadelphia, Signature Properties focuses on buying homes directly from owners—offering cash purchases, quick closes, and as-is acquisitions for homeowners seeking alternatives to traditional listing.
Data sources: Pennsylvania Association of Realtors, ATTOM Data Solutions, Bright MLS, county recorder offices, and Signature Properties internal survey (https://www.sellmyphillyhouse.com/we-buy-houses-pennsylvania/).