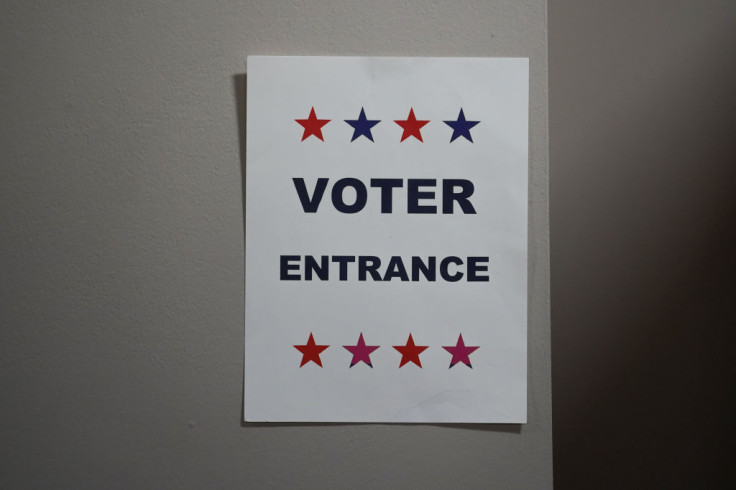
SEATTLE - With less than a month to go before Election Day, Republicans and Democrats alike continue to campaign all across the United States in their last attempts to lure in more voters to their cause. But before the general population goes out to vote on Nov. 5, polls and studies can be great indicators on how people in the U.S. plan to assert one of the most important rights granted by the U.S. Constitution: the right to vote.
It is well known that the United States is a melting pot where people from all sorts of cultures and ethnicities come together to form a single identity. But being so diverse can come with certain complications when it comes to elections, as not every group can be accurately represented in the way the general population votes.
According to a recent study by WalletHub, low voter turnout among certain demographic groups tends to paint a not-so-accurate reflection of the general population, as people who go to the polls usually count with an advantage over certain groups that do not go out to vote.
Representing the actual demographics of electorates based on race, age, gender and other key factors such as socioeconomic status, educational attainment and marital status is key in order to better understand voters. But as the study found out, those demographics can be totally different depending on which state you live in.
Cassandra Happe, one of the analysts in charge of the study, mentions that when large segments of the population do not vote, it can "skew future economic and social policies to favor those who did vote, to the detriment of those who did not." Happe added that states were the voting population most closely matches the electorate "are more likely" to elect representatives and institute policies that help all demographics.
By comparing the distribution of the voting population in each of the 50 states to the distribution of the state's total population by race, age and gender, the study was able to detect how accurately different groups are actually represented during the electoral process.
For example, in New Jersey, voters in the Garden State most closely resemble their actual electorate, earning 96.6 points out of a possible 100 in WalletHub's study. New Jersey scored high in terms of discrepancy between Asian and Hispanic residents who were eligible to vote in 2020 and those who actually voted, ranking second-lowest and seventh-lowest, respectively.
New York was another state that ranked high in terms of how well its voters represent the overall population eligible to vote. The Empire State earned 94.1 points thanks to scoring well in categories such as age, race, as well as ranking decently in gender.
New York's share of Black people who could and did vote in the 2020 election gave the state the eight-lowest discrepancy nationally despite ranking 13th in the study's race representation index.
When it comes to racial representation, a couple of states in the Northeast obtained the lowest score. Massachusetts, North Dakota and New Hampshire are the three states with the biggest discrepancies between eligible voters and those who actually voted. With minority voters less likely to show up at the polls in Massachusetts, the Bay State ranked 49th nationally in terms of share of voters that least represent the U.S. population.
General outlook
According to WalletHub's data, women in the United States voted at a higher rate during the 2020 presidential election than its actual share of the population. Women were responsible for 53% of voters despite representing almost 52% of the general population.
When it comes to race, Latinos had the biggest discrepancy in terms of eligible voters and those who actually voted among minorities. Latinos represent 13.22% of the general population, yet only 10.64% of eligible voters among the demographic participated during the 2020 elections.
Family income was also taken into account by the study, and data collected showed that the more people make, the more likely they are to assert their right to vote. Families that made less than $50,000 had the biggest discrepancies between those who voted and those eligible to vote, while families who made $150,000 or more were the most likely to vote (23.73%).
© 2024 Latin Times. All rights reserved. Do not reproduce without permission.


