During the UK general election campaign, we worked with colleagues to create a series of maps that show both how the climate has changed over the past two generations in each constituency, and how it will change over the next decade.
You can look up the climate changes for your own constituency and see how they compare to the local actions promised in election leaflets coming through your door.
We used combined data from the Met Office and other national weather services, which shows that the UK, like the rest of the world, has warmed since the 1960s. The warming is largest in the south-east, with temperatures in Westminster itself having gone up by a whole degree celsius, averaged across the year.
The UK saw one of the wettest winters on record this year, and increasing rainfall in both winter and summer over the past decades can be seen in the maps.
Changes in winter rainfall (%):
Note: These maps are best viewed on a desktop screen. Past changes show the difference between 30 year periods centred on the 2000s and the 1970s.
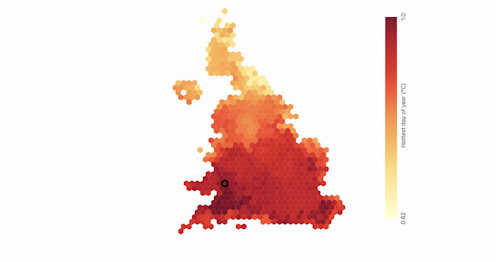
You can also explore changes in extreme weather using the maps. The temperature of the warmest day of the year, for example, has increased at a faster rate than the annual average, which fits with the increasing heatwaves that have plagued the country in recent years.
Changes in hottest day of the year (°C):
Flooding is often associated with heavy rainfall over several days, and increases in storm rainfall by 20% have been attributed to climate change.
Mapping changes in the amount of rainfall on the five wettest days of the year in a row, show large increases over the Lake District, west Wales and the Scottish Highlands – all areas that have suffered badly from flooding in recent years.
Change in rain on five wettest consecutive days (%):
What the future holds
The UK is failing to adapt to the changing climate. The Climate Change Committee, the government’s official advisers, found the UK was making sufficient progress on only six out of the 61 risks identified in its most recent assessment. In its analysis of all the manifestos, Carbon Brief found that only the Labour party mentions helping the UK adapt to climate change.
But before we can adapt local areas to the coming climate, we first need to understand what that climate looks like. This is tricky, as global climate models – computer programs that can simulate the climate – require lots of computing time and don’t provide results down to the level of individual constituencies. To get information on local areas, we need to feed the global model’s output into another model specifically focused on climate changes on smaller scales.
We then ran these programs focused on each UK constituency and looked at how the projected climate averaged between 2021 and 2040 would compare to the actual weather averaged over 1981-2010 (it’s more useful to compare these longer-term averages, since the weather fluctuates a lot from year to year).
For almost every constituency, the models projected somewhere between a 5% and 10% increase in rainfall over winter.
Projected change in winter rainfall (%):
Note: Future projections show the difference between conditions averaged over 2021-2040 and those averaged over 1981-2010.
In summer, there would instead be reductions in rainfall, though less dramatic.
The average climate over the year is projected to warm by 0.75°C throughout most of the UK. But the temperature of the hottest day of each year will generally warm by more than that. This could be even worse in inner-city areas, as even these regional climate models can’t “zoom in” close enough to capture the full impact of the urban heat island effect.
Projected change in hottest day temperatures (°C):
Climate change in this election campaign
Climate change has not been particularly visible in the election campaign. This has led Greenpeace to run a campaign asking people to explicitly flag to their candidates that climate is an issue for them.
Three perspectives are important here: the past and two different future horizons. We can look backwards at weather data to see how the climate has already changed. Globally, we’re already experiencing a climate that is 1°C warmer than preindustrial times, and last year was 1.45°C warmer. Our emissions already commit the world further warming. However, the speed at which we achieve net zero has large consequences for how much the climate will change heading into the next century.
The Intergovernmental Panel on Climate Change (IPCC) divides climate responses into two categories, “adaptation” or coping with the symptoms, and “mitigation” or reducing the causes of climate change. They often require fundamentally different approaches. For example, better flood defences to cope with climate-intensified rainfall and a shift to renewable energy to reduce our use of gas-fired power plants that led to that intensification. The vast majority of climate discussion in the UK election campaign has centred on mitigation, especially around the costs of net zero.
We find this odd, because adaptation is fundamentally a local issue and the UK’s electoral system emphasises local issues. Perhaps providing local climate changes for your own constituency, will help you ask pertinent questions to candidates on your doorstep in future elections.
Chris Brierley received support from the Met Office to a run the hackathon during which the initial idea for this research arose.
Hannah Woodward does not work for, consult, own shares in or receive funding from any company or organisation that would benefit from this article, and has disclosed no relevant affiliations beyond their academic appointment.
This article was originally published on The Conversation. Read the original article.


