When the 50-day moving average crosses over the 200-day moving average, it’s called a golden cross — a powerful technical pattern that indicates incoming bullish momentum. When the same moving average crossover happens in reverse (the 50-day moving average dips below the 200-day moving average) it's called a death cross. The death cross is an equally powerful moving average crossover indicating bearish (rather than bullish) trend direction.
The golden cross and the death cross are both highly consistent medium-to-long-term technical indicators that can take weeks or months to play out — but did you know you can use the same moving average crossover principle for your short-term day trades?
Start trading the technicals, with Rebel Weekly. Ride the waves of market momentum with two actionable trade ideas designed to capture technical breakouts and breakdowns — delivered to your inbox every week.
Trading Crossovers in the 3 and 8-Day Moving Averages
It's hard to beat the "buy-and-hold" S&P 500 strategy through day trading — but according to a recent backtest of the SPY ETF, trading moving average crossovers in the 3 and 8-day MA is a strategy that has managed to do just that. It works like this:
- Create two indicators on your chart: The 3-day moving average, and the 8-day moving average.
- When the short-term, 3-day moving average crosses above the 8-day moving average, that's your "mini golden cross" — a technical crossover that indicates bullish trend direction.
- When the reverse happens, and the 3-day moving average crosses below the 8-day moving average, that's your "mini death-cross" — a technical crossover that indicates bearish trend direction.
When trading, you can use the bullish moving average crossover as a buy indicator, and the bearish moving average crossover as a sell indicator — or, if you're particularly bold, as a trigger to enter a short position.
Start following the smart money, with Unusual Option Activity. Learn how you can follow institutional trades and get a fresh UOA trade idea every week - including technical levels that tell you where to enter and exit!
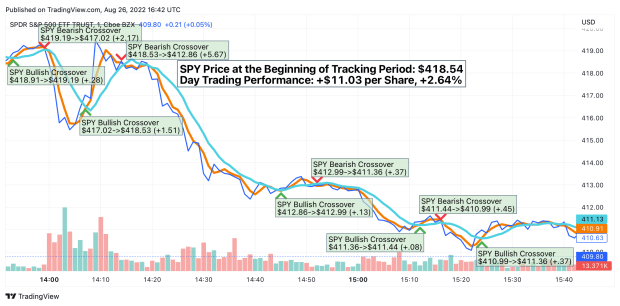
August 26th Intraday Moving Average Crossover Analysis in the SPY ETF

Market Rebellion, TradingView
We decided to test the success of this strategy during a short period on the day this article was written. Within a period of roughly two hours, the (SPY) ETF experienced nine instances of the 3-day moving average crossing over the 8-day moving average. All nine moving average crossovers resulted in positive theoretical trades.
During the two-hour analysis, the price of the SPY ETF moved from $418.54 to $410.63: a bearish move of -$7.91, or -1.89%. By following the trading signals in this moving average crossover strategy, a trader could have earned $11.03 per share, or +2.64%. And of course, through the leveraging power of short-duration options, a trader could have significantly amplified those theoretical gains.
Is Trading With a Technical Indicator Really Worth It?
Short answer: Yes.
No matter how many successful backtests are conducted on a particular technical indicator, there will never be a shortage of people casting doubt on the veracity of technical analysis. On Wall Street Bets, a popular meme refers to traders who rely on a technical indicator to craft their trades as "crayon-users", with technical levels referred to as "magic lines".

r/wallstreetbets
But traders should be careful about throwing technical analysis out the window. Whether you believe in the notion behind a particular technical indicator or not, there are plenty of traders who do — and their large trades can turn technical signals like these moving average crossovers into a self fulfilling prophecy.
Perhaps more important than the human traders who use technical analysis are the computer traders — the algorithms. Trading algorithms make up roughly 2/3's of all (yes, all) trading volume. These AI-powered trading bots aren't buying and selling based on "fundamental analysis" or “feelings”, these bots are by-and-large programmed to make lightning-fast trades based purely on technical analysis and trend direction. This further bolsters the point about technical analysis having a tendency to become a self fulfilling prophecy.
The Bottom Line: Whether you believe in the thesis behind a technical indicator like moving average crossovers or not, if you're interested in day trading, it pays to pay attention.


