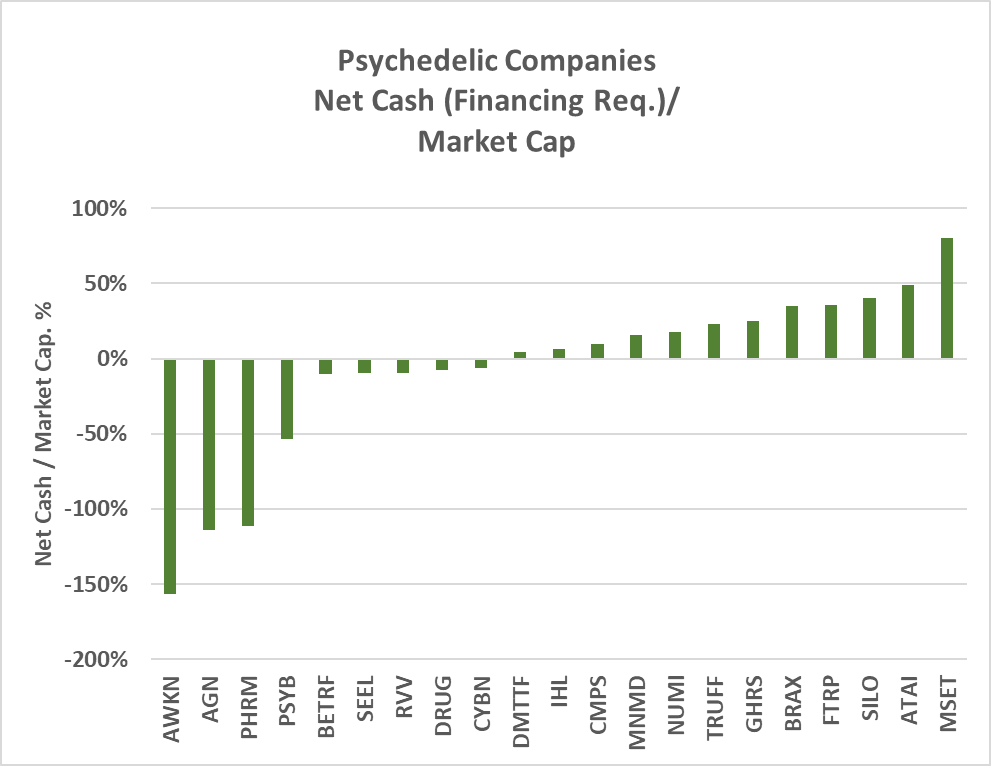
The Chart represents the liquidity positions of the 21 Psychedelic sector companies in the Viridian Value Tracker database.
-
We estimated each company's Net Cash Flow Position by adding the most recent quarter's cash balance to the projected year ahead Free Cash Flow. Consensus analyst estimates of free cash flow were used if available; otherwise, the most recent quarter's free cash flow (cash from operations minus CAPEX) was annualized.
-
Only one company on the list, Mindset Pharma (OTC:MSSTF), has positive estimated free cash for 2023. The graph measures how well each company's cash balance covers its projected cash burn.
-
The scale of the companies is drastically different. PsyBio Therapeutics (OTC:PSYBF) has a market cap of about $8M, while GH Research PLC (NASDAQ:GHRS) tops $825M. To show the liquidity position on a common basis, we divided each value by the company's market cap.
-
For example, Awakn Life Science (OTC:AWKNF) has a value of -156%, which indicates that the company is estimated to have a financing need (net of their cash on hand) of 156% of its market cap - a hefty raise. Conversely, Mindset Pharma has net cash equal to 80% of its market cap, a very comfortable liquidity position.
-
Psychedelic companies have raised approximately $215M YTD, far above the less than $50M raised in 2021. The acceleration in capital raises indicates the market's fascination with this new subsector.
-
The majority of the group has sufficient cash to fund themselves for the following year.
-
However, the nine companies with negative net cash will need to raise a cumulative $80M (27% of the cumulative market cap). Negative cash flow and challenged liquidity in a risk-off market is a difficult position. Will the market's fascination with Psychedelics be enough to compensate?
The Viridian Capital Chart of the Week highlights key investment, valuation and M&A trends taken from the Viridian Cannabis Deal Tracker.
The Viridian Cannabis Deal Tracker provides the market intelligence that cannabis companies, investors, and acquirers utilize to make informed decisions regarding capital allocation and M&A strategy. The Deal Tracker is a proprietary information service that monitors capital raise and M&A activity in the legal cannabis, CBD, and psychedelics industries. Each week the Tracker aggregates and analyzes all closed deals and segments each according to key metrics:
-
Deals by Industry Sector (To track the flow of capital and M&A Deals by one of 12 Sectors - from Cultivation to Brands to Software)
-
Deal Structure (Equity/Debt for Capital Raises, Cash/Stock/Earnout for M&A) Status of the company announcing the transaction (Public vs. Private)
-
Principals to the Transaction (Issuer/Investor/Lender/Acquirer) Key deal terms (Pricing and Valuation)
-
Key Deal Terms (Deal Size, Valuation, Pricing, Warrants, Cost of Capital)
-
Deals by Location of Issuer/Buyer/Seller (To Track the Flow of Capital and M&A Deals by State and Country)
-
Credit Ratings (Leverage and Liquidity Ratios)
-
Since its inception in 2015, the Viridian Cannabis Deal Tracker has tracked and analyzed more than 2,500 capital raises and 1,000 M&A transactions totaling over $50 billion in aggregate value.
The preceding article is from one of our external contributors. It does not represent the opinion of Benzinga and has not been edited.