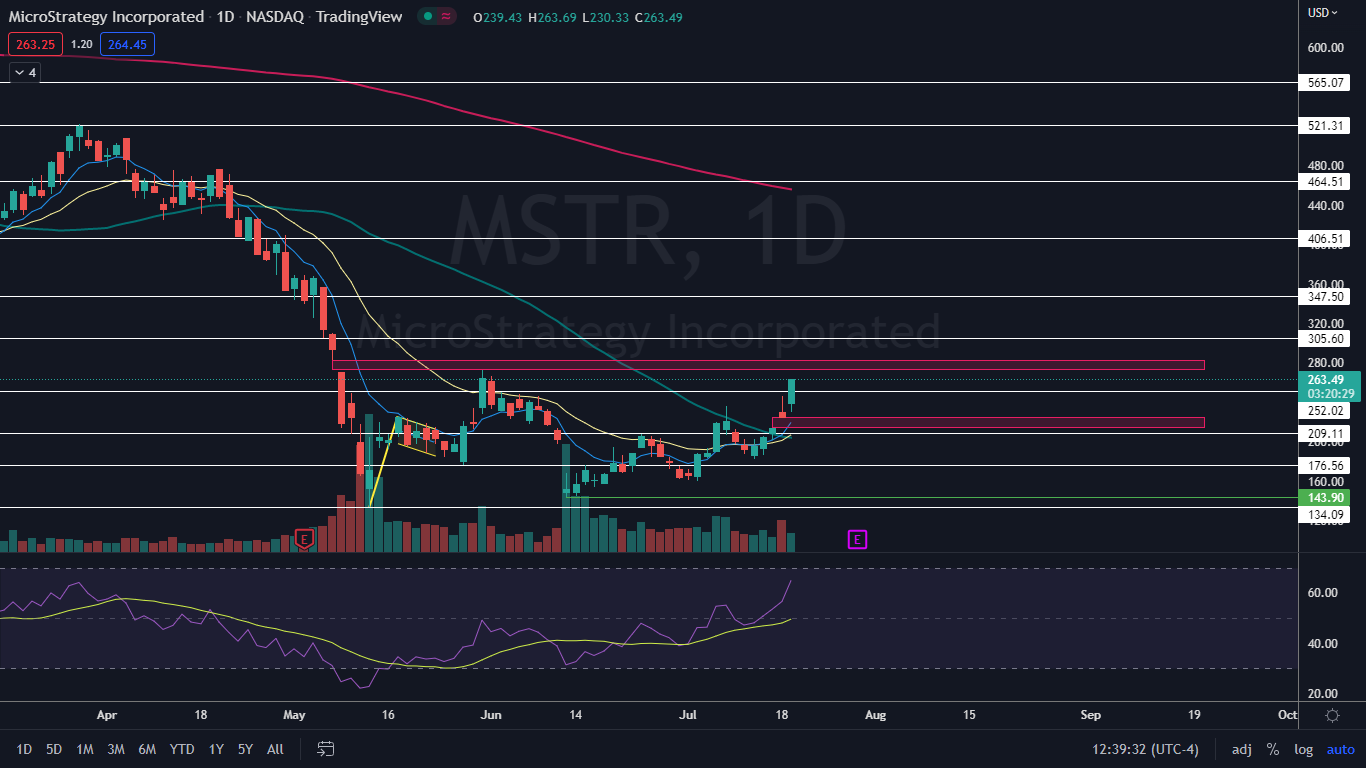
MicroStrategy Incorporated (NASDAQ:MSTR) was soaring about 16% higher on Tuesday after spending Monday’s trading session consolidating a gap up that took place due to Bitcoin (CRYPTO: BTC) showing strength prior to the stock market opening.
Bitcoin rallied 8% on Monday, and during Tuesday’s 24-hour trading session the crypto began by consolidating with an inside bar pattern before breaking up from Monday’s mother bar.
The price action boosted MicroStrategy because the software and cloud-based services company holds 129,699 Bitcoins, according to Bitcoin Treasury data. MicroStrategy’s stake in the crypto is valued at about $3.01 billion.
MicroStrategy’s movement is also tied to the S&P 500, which was also experiencing bullish price action. The ETF was trading up over 2% at the time of writing and also breaking up from an inside bar pattern to surpass Monday’s high-of-day.
The bullish action in MicroStrategy can also be tied to the continuation of an uptrend, which the stock reversed into June 13 after reaching a low of $143.90.
Want direct analysis? Find me in the BZ Pro lounge! Click here for a free trial.
The MicroStrategy Chart: MicroStrategy’s most recent higher low in its uptrend was printed on July 13 at $182.45 and the most recent confirmed higher high was formed at the $236.28 mark on July 8. On Tuesday, MicroStrategy surpassed the July 8 high-of-day as well as Monday’s high-of-day, which confirmed the uptrend is still intact.
- Bullish traders who aren’t already in a position may choose to wait for MicroStrategy to print its next higher low before entering into a position. A higher low can often be identified by watching for a reversal candlestick, such as a doji or hammer candlestick, to print above the most recent higher low.
- A pullback is likely to come over the next few days because MicroStrategy’s relative strength index is measuring in at about 65%. When a stock’s RSI reaches or nears the 70% level it becomes overbought, which can be a sell signal for technical traders.
- MicroStrategy has two gaps on its chart, with the closest gap above between $272.88 and $282.55 and the lower gap falling between $213.98 and $225.63. Gaps on charts fill about 90% of the time, which makes it likely the stock will trade into both empty ranges in the future.
- The stock has resistance above at $305.60 and $347.50 and support below at $252.02 and $209.11.


