
March Madness runs on chaos that can happen anywhere, at any time and to any team. That’s exactly why filling out a bracket is an exercise in balance and overconfidence: trust the best teams, but select enough upsets to separate from the crowd. But the bracket is not equally fragile in every spot. The history of the men’s NCAA tournament offers a guide for where upsets happen, and the clearest place to start is the round of 64, where the same seed-based matchups occur each year.
Round of 64
| Matchup | Higher Seed Record | Higher Seed Win Percentage |
|---|---|---|
| No. 1 vs. No. 16 | 158–2 | 98.8% |
| No. 2 vs. No. 15 | 149–11 | 93.1% |
| No. 3 vs. No. 14 | 137–23 | 85.6% |
| No. 4 vs. No. 13 | 127–33 | 79.4% |
| No. 5 vs. No. 12 | 103–57 | 64.4% |
| No. 6 vs. No. 11 | 98–62 | 61.3% |
| No. 7 vs. No. 10 | 98–62 | 61.3% |
| No. 8 vs. No. 9 | 77–83 | 48.1% |
Historically, the No. 1, No. 2 and No. 3 seeds hold a combined 444–36 record over their lower-seeded counterparts, and there’s never been an edition of March Madness where more than two of those seeds have lost in the round of 64. (The chalk is chalk for a reason.)
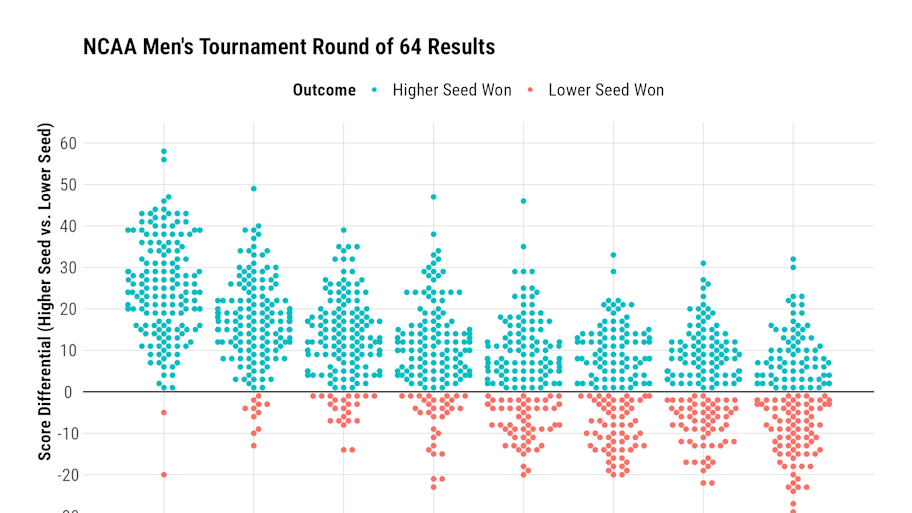
The middle of the bracket is where games become more coin-flippy. The No. 5 seed has fallen half of the time in three of the last four tournaments. The No. 6 seed won three out of four games in 2023 and ‘25, but it lost three out of four games in ‘22 and ‘24. (That’s not a new trend: The No. 6 seed had a 19–21 record from 2011 to ’21.)
And, of course, the No. 8 team is the higher seed in rank only. Since the NCAA dropped RPI ahead of the 2018 season and used NET rankings to evaluate teams for inclusion in the tournament, the No. 9 seed has a 15–9 record in the first round.
Round of 32
| Matchup | Higher Seed Record | Higher Seed Win Percentage |
|---|---|---|
| No. 1 vs. No. 8 | 61–16 | 79.2% |
| No. 1 vs. No. 9 | 75–6 | 92.6% |
| No. 2 vs. No. 7 | 65–27 | 70.7% |
| No. 2 vs. No. 10 | 37–20 | 64.9% |
| No. 3 vs. No. 6 | 49–33 | 59.8% |
| No. 3 vs. No. 11 | 35–20 | 63.6% |
| No. 4 vs. No. 5 | 45–37 | 54.9% |
| No. 4 vs. No. 12 | 32–13 | 71.1% |
| No. 5 vs. No. 13 | 18–3 | 85.7% |
| No. 6 vs. No. 14 | 14–2 | 87.5% |
| No. 7 vs. No. 15 | 2–4 | 33.0% |
| No. 9 vs. No. 16 | 2–0 | 100% |
| No. 10 vs. No. 15 | 5–0 | 100% |
| No. 11 vs. No. 14 | 7–0 | 100% |
| No. 12 vs. No. 13 | 9–3 | 75.0% |
The numbers above measure how often a given seed wins its particular matchup once it reaches the round of 32. Zooming in, the No. 3 vs. No. 6 clash is susceptible to the most upheaval among contests involving a top-three seed. At least one three-seed has lost this specific matchup in four of the last five tournaments. (That is a recent trend. The No. 3 seed held a 7–0 record against the No. 6 seed from 2015 to ’19.) Elsewhere, a No. 4 vs. No. 5 contest is close to a toss-up.
Many of the win rates above can be explained by small sample size noise. For example, there have only been six No. 7 vs. No. 15 matchups. If those two seeds faced off more frequently, then the current winning percentage likely wouldn’t hold. But, the Nos. 2 and 4 seeds appear to fare better when facing a Cinderella-hopeful.
Sweet 16 advance rates
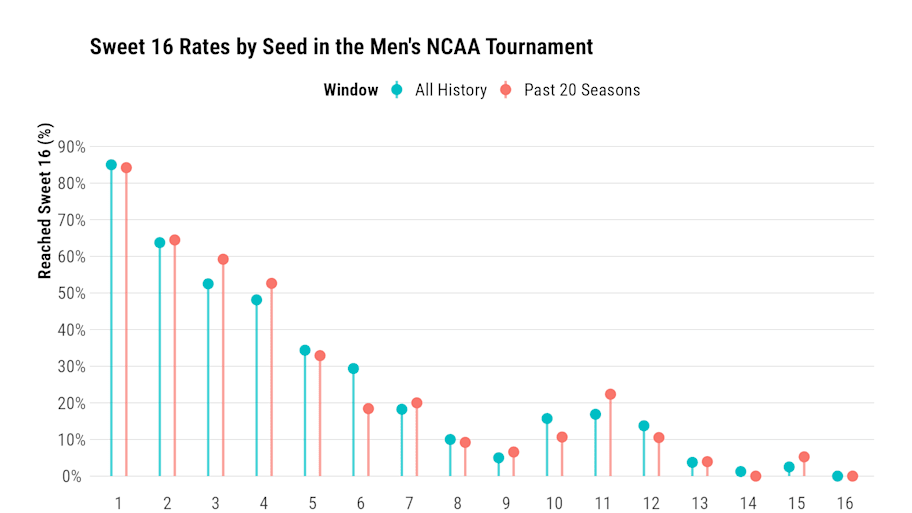
Pulling back, the historical round of 32 win rates also help inform how frequently different seeds reach the Sweet 16, shown in the chart above. Does the public adhere to what history suggests, though? Not quite. Consider: The public chose the No. 3 seed to reach the Sweet 16 about 61.7% of the time last year, more than nine percentage points higher than the historical average. The gap was even wider for No. 2 seeds, whom the public advanced to the Sweet 16 at a 79% clip, nearly 16 points higher than history suggests they should.
Last year’s teams split the difference. Three out of four No. 2 seeds advanced to the Sweet 16, while two out of four No. 3 seeds advanced to the Sweet 16.
The lesson? History doesn’t make the bracket any easier to solve, but it does help map out where chaos usually starts.
More March Madness from Sports Illustrated
Listen to SI’s college sports podcast, Others Receiving Votes, below or on Apple and Spotify. Watch the show on SI’s YouTube channel.
- Texas vs. NC State Prediction, Odds, Key Player to Watch for NCAA Tournament First Four
- March Madness: Five Teams to Avoid in Your Men’s NCAA Tournament Bracket
- How Many Teams Did Each Conference Land in 2026 March Madness Field?
- Aden Holloway Arrested, Not With Team Ahead of Alabama’s NCAA Tournament Game
This article was originally published on www.si.com as March Madness Brackets: Where Do Upsets Happen in the Men’s NCAA Tournament?.