We have a fairly mixed reaction out of Johnson & Johnson (JNJ) so far on Tuesday.
The shares are down about 0.5% after the health-care giant reported third-quarter results.
Earnings fell 1.9% year over year, revenue grew 1.9%, and both metrics beat analysts’ expectations.
Some investors are saying the muted reaction stems from the company’s action one month ago, when it affirmed its full-year outlook and announced a $5 billion buyback plan.
That’s a reasonable takeaway, even as management just gave a boost to its full-year earnings expectations to the tune of 5 cents a share. It's now expecting earnings of between $10.70 and $10.75 per share.
A top- and bottom-line beat paired with a boost in earnings and a higher overall market is usually a recipe for a stock rally. Let’s check the charts amid today’s action.
Trading J&J Stock on Earnings
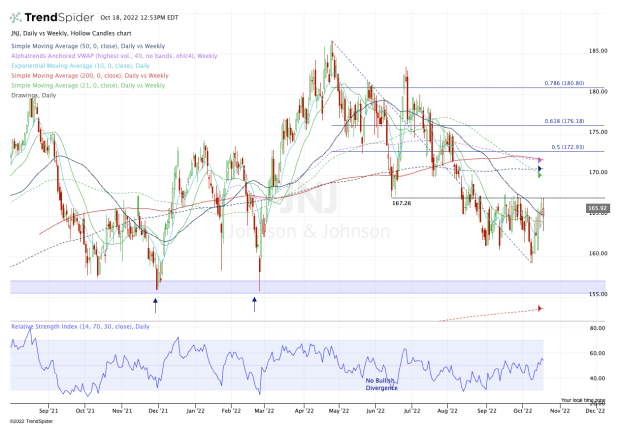
Chart courtesy of TrendSpider.com
Given that J&J beat consensus earnings expectations by 7 cents a share, one could argue that the fourth-quarter results (and raised guidance) are already baked into the current stock price.
Further, the shares are up about 2.5% since management affirmed its outlook on Sept. 14.
Investors can go back and forth all day on whether this stock should be up, down or sideways, but thankfully the charts are fairly direct.
The stock needs to clear the $167.25 to $167.50 area. This zone has played a pivotal role as both support and resistance. Currently, it's the latter.
If J&J stock can't clear this zone, it may continue chopping in the low- to mid-$160s.
If that level fails, investors may get a chance to steal some shares down in the $155 to $157 region as patient buyers have done in the past.
If, however, Johnson & Johnson stock can clear $167.50, it opens the door to the $170 to $173 area.
In this zone, we find a bevy of moving averages, including the 21-week, 50-week and 200-day. It also includes the weekly VWAP measure and the 50% retracement of the current range.
If it can clear this zone, then $176 is in play, followed by the low $180s.
It all starts with clearing $167.50. Keep that level circled on your charts.