Ethereum Classic (CRYPTO: ETC) was trading over 4% higher on Tuesday afternoon, after spiking up over 11% between 5:00 a.m. and 7:00 a.m EDT.
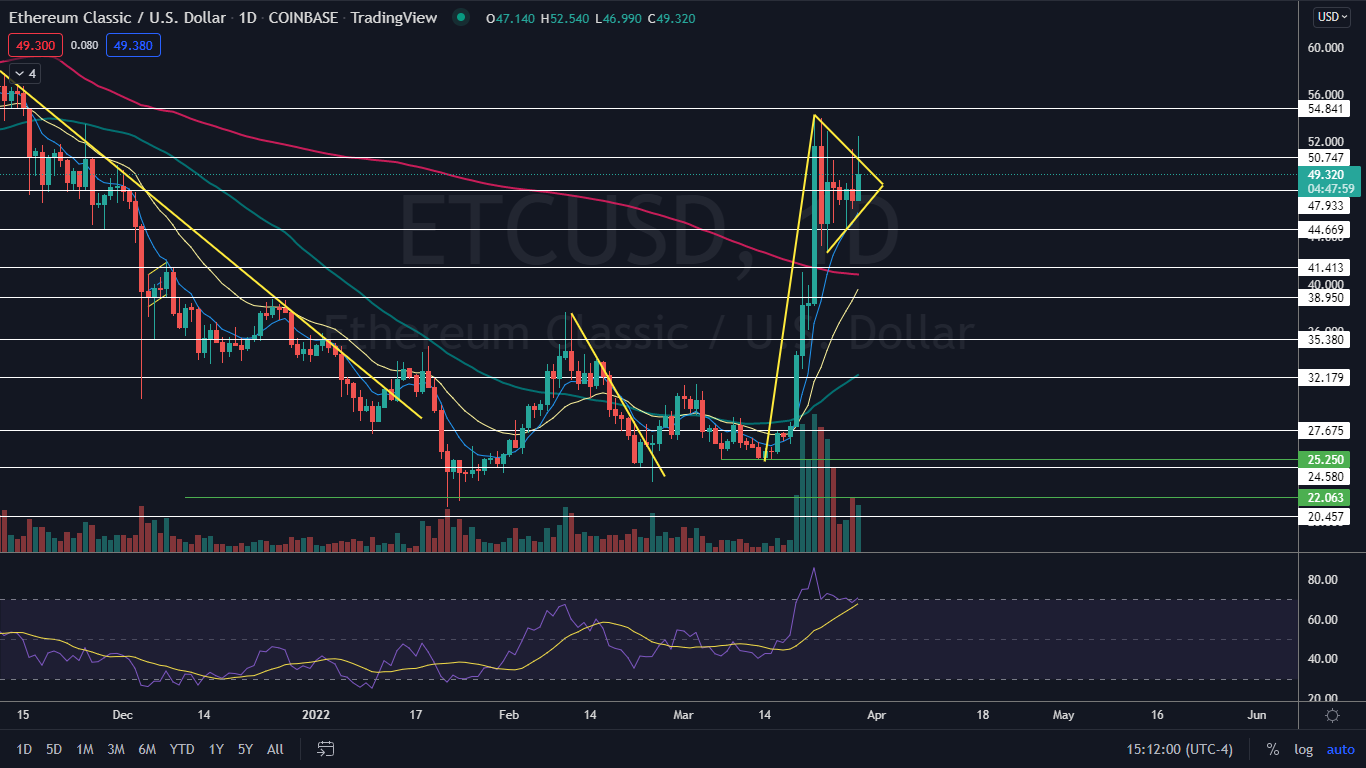
For the past seven 24-hour trading days the crypto has been consolidating the 116% rally that took place between March 14 and March 22, and in its consolidation, Ethereum Classic has settled into bullish flag pattern on the daily chart.
The bull flag pattern is created with a sharp rise higher forming the pole, which is then followed by a consolidation pattern that either brings the stock lower between a channel with parallel lines or into a triangle shaped tightening pattern.
- For bearish traders, the "trend is your friend" (until it's not) and the stock may continue downwards within the following channel for a short period of time. Aggressive traders may decide to short the stock at the upper trendline and exit the trade at the lower trendline.
- Bullish traders will want to watch for a break up from the upper descending trendline of the flag formation, on high volume, for an entry. When a stock breaks up from a bull flag pattern, the measured move higher is equal to the length of the pole and should be added to the lowest price within the flag.
A bull flag is negated when a stock closes a trading day below the lower trendline of the flag pattern, or if the flag falls more than 50% down the length of the pole.
See Also: How to Read Candlestick Charts for Beginners
The Ethereuem Classic Chart: When Ethereum Classic spiked up on Tuesday morning, the crypto attempted to break up bullishly from the bull flag pattern, but rejected the move due to lower-than-average volume. Ethereum’s flag formation is taking place within a triangle pattern, and traders and investors can watch for a break up or down from the flag before the crypto reaches the apex on April 2 to gauge future direction.
- If the crypto breaks up from the bull flag pattern, the measured move is about 116%, which indicates Ethereum Classic could skyrocket above the $90 level in the future.
- Ethereum Classic is trading above the eight-day and 21-day exponential moving averages (EMAs), with the eight-day EMA trending above the 21-day, both of which are bullish indicators. The sideways consolidation has allowed for the eight-day EMA to catch up to Ethereum Classic’s price, which may continue to guide the crypto higher.
- The crypto is also trading above the 200-day simple moving average (SMA), which indicates long-term sentiment is bullish. If the crypto is able to remain above the level for a period of time, the 50-day SMA will cross above the 200-day, which would cause a golden cross to occur.
- Ethereum Classic may need to trade sideways for a longer period of time before breaking from the flag formation because the relative strength index is still registering near overbought territory at about 70%.
- Ethereum Classic has resistance above at $50.74 and $54.84 and support below at $47.93 and $44.66.
Want direct analysis? Find me in the BZ Pro lounge! Click here for a free trial.

Photo: Courtesy of ETC on Flickr


