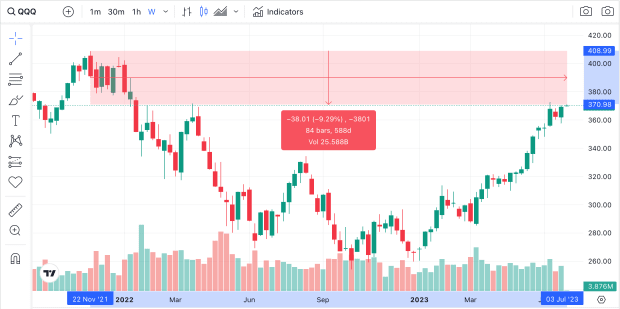
The QQQ is currently up more than 40% YTD, its best first half of the year in decades. However, the ETF still trades more than 9% below its November 2021 all time high of $408.71.

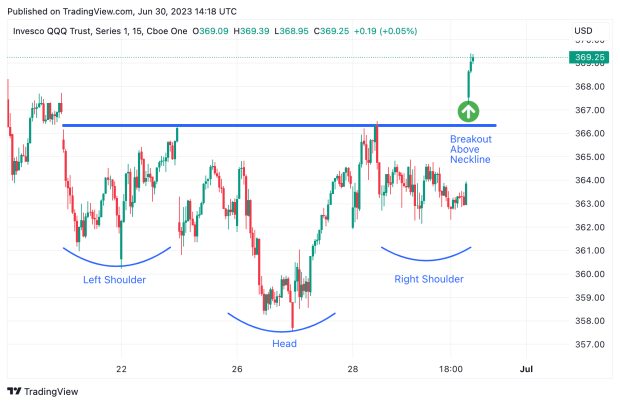
Last week, the QQQ broke out of a short-term inverse head and shoulders pattern.
What is an Inverse Head and Shoulders Pattern
An inverse head and shoulders pattern is a technical analysis pattern commonly seen in the stock market. It typically signals a bullish reversal in the price trend of an asset. The pattern consists of three distinct parts: two lower lows on either side (the left and right shoulders) and a lower low in the middle (the head).
The shoulders are generally at a similar price level, while the head is lower. The pattern is completed when the price breaks above the neckline, which connects the high points of the shoulders. This breakout often indicates a shift in market sentiment, suggesting that the asset's price may rise in the future. Traders and investors use the inverse head and shoulders pattern to identify a potential buying opportunity.
QQQ Inverse Head and Shoulders Spotted

Last week, the QQQ broke out of an inverse head and shoulders with strength and volume, indicating the potential for more upside ahead as we enter the second half of the year.
While it wouldn’t be surprising to see tech stocks take a short breather after the massive rally we’ve seen, it’s worth noting that this correlates to history: July is typically a positive month for the stock market.
Stocks ended higher during 9 of the past 10 July’s, with an average S&P 500 return of over 3%. With a Nasdaq that has been handily outperforming the S&P 500 this year, it’s believable that the Nasdaq could continue that outperformance.


