
Get all your news in one place.
100's of premium titles.
One app.
Start reading
The Economic Times
The Economic Times
Shreya Biswas

In 1850, scientists began recording the temperatures that would reveal Earth's climate trajectory. 172 years later, researchers found 45 years of satellite observations are enough to detect human warming in most regions

Scientists have long established that the current rise in global temperatures is caused by human activity. But showing how that warming appears across different parts of the world has been more difficult.

Researchers at the Max Planck Institute for Meteorology have now developed a way to identify the regional pattern of human-caused climate change directly from temperature observations, as per a report.

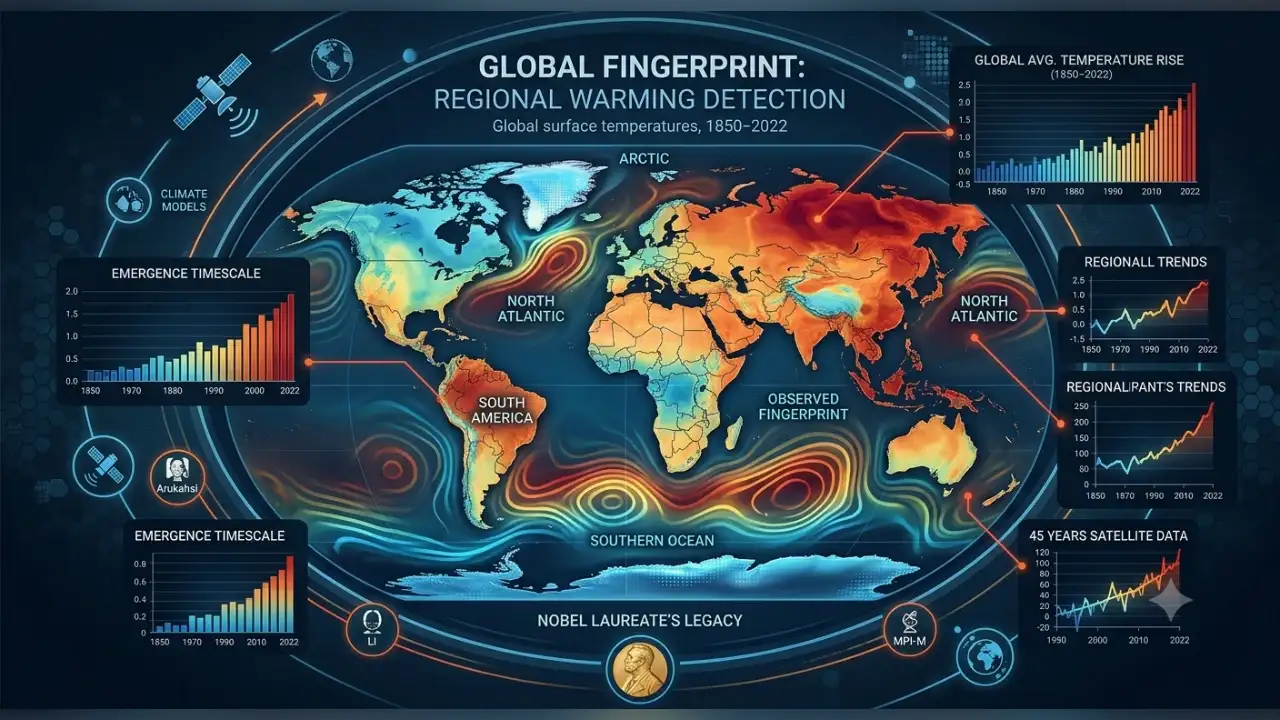
The team analyzed global surface temperature records from 1850 to 2022 and examined how temperatures in individual regions changed alongside the rise in global average temperature. Because observations and climate models agree closely on the global temperature increase, the researchers used that increase as a reference for identifying the human influence at the regional level.

The study, published in Science Advances, also provides a way to compare observed regional changes with climate model predictions.

Temperature records reveal a regional fingerprint

The researchers created an "observed fingerprint" from measured surface temperatures and used it to examine how regional temperatures changed in relation to the global average, as per a Phys.org report. The approach is particularly useful because observations and model predictions do not always agree at the regional level.

The southeastern Pacific and parts of the Southern Ocean have cooled, while the subpolar North Atlantic has warmed less than expected. The differences have raised questions about how consistently the warming pattern associated with rising greenhouse gas levels appears in different regions.

The new method gives researchers a way to investigate those differences using observations.

READ ALSO: In 2015, a California design student launched a plantable coffee cup after raising $21,077 on Kickstarter. 11 years later, the idea still hasn’t reached shelves, but compostable coatings may finally solve its biggest problem

Four regions show the role of natural variability

The researchers focused on the southeastern Pacific, the Southern Ocean, the subpolar North Atlantic and the Arctic, where uncertainty between observations and models is particularly high.

The Arctic shows how natural variability can temporarily affect a warming trend. Temperatures there rose rapidly from the middle of the 20th century, before warming slowed from the late 1990s to the early 2010s.

The study found that natural variability caused this slowdown, although human influence remained detectable. The southeastern Pacific showed a similar pattern.

In parts of the Southern Ocean and the subpolar North Atlantic, however, human-induced warming has not clearly emerged from natural climate fluctuations.

Some regions need more time to show human influence

The time needed for the human influence to become distinguishable from natural variability varies from one region to another.

Lead author Aruhasi calls this the "emergence timescale," which the study says is often underestimated by climate models, as per the Phys.org report.

The measure can help researchers determine how long observations need to continue before human influence can be demonstrated clearly in a particular region.

Chao Li, MPI-M group leader and co-author, said "The current period of satellite observations, at around 45 years, is sufficient to provide purely empirical evidence of human-induced warming in most regions," as quoted by Phys.org.

READ ALSO: In May 2026, Hawaii wildlife crews found 10 endangered caterpillars on Lānaʻi. Weeks later, they found the same moth on Molokaʻi for the first time since the 1940s

Building on a method developed by Klaus Hasselmann

Detection and attribution is a standard approach in climate research. Researchers first determine whether a climate change is statistically different from natural fluctuations and then identify its cause.

The method is based on work by Nobel laureate Klaus Hasselmann, the founding director of the Max Planck Institute for Meteorology.

Traditionally, climate models have been used to identify the characteristic pattern produced by a particular influence. Increasing greenhouse gas concentrations, for example, cause the troposphere to warm while the stratosphere cools. Warming is also generally stronger over land than over oceans, while the Arctic warms particularly quickly.

The observed climate record carries this broader pattern, making the human cause of current global warming unequivocal.

The new approach builds on that work by showing how the human influence appears in different regions using actual temperature records.

What the new approach could help explain

The method provides another way to examine why observed regional temperature changes sometimes differ from model expectations.

It can also help researchers assess how closely observations match model-based expectations and better understand uncertainties in climate models.

The researchers say the approach could have relevance for adaptation planning and climate litigation.

After 172 years of temperature records, researchers now have another way to examine how human-caused warming appears across different parts of the world and when that influence becomes distinguishable from natural climate variability.

READ ALSO: In 2016, Denmark opened a plant using dry separation to recycle artificial turf. 5 years later, it had processed 662 fields and recovered up to 95% of their materials

Sign up to read this article
Read news from 100's of titles, curated specifically for you.
Already a member? Sign in here
Related Stories
Top stories on inkl right now
One subscription that gives you access to news from hundreds of sites
Already a member? Sign in here
Our Picks
Fourteen days free
Download the app
One app. One membership.
100+ trusted global sources.