
Ford Motor Company (NYSE:F) is set to print its third-quarter financial results after the market close Tuesday, Oct. 26. The heavily beaten-down stock was trading flat heading into the event and remains down over 50% from the Jan. 13, 52-week high of $25.87.
When the legacy-turning-electric vehicle manufacturer printed its second-quarter results on July 27, the stock had settled into a bull flag pattern on the daily chart, from which Ford broke higher the following day.
Ford then soared 32% higher over the 15 trading days that followed, where the stock topped out at the 200-day simple moving average, which was trending at about $16.68.
For the second quarter, Ford reported an EPS of 68 cents on revenue of $37.91 billion. Both numbers topped consensus analyst estimates of 45 cents and $34.32 billion, respectively.
For the third quarter, analysts expect Ford to report an EPS of 32 cents on revenues of $36 billion.
On Oct. 10, UBS analyst Patrick Hummel downgraded Ford from Neutral To Sell and lowered the price target from $13 to $10. In contrast, on Oct. 5, Morgan Stanley analyst Adam Jonas upgraded the stock from Equal-Weight to Overweight and announced a $14 price target.
From a technical analysis standpoint, Ford’s stock looks headed higher following the earnings print. It should be noted that holding stocks or options over an earnings print is akin to gambling because stocks can react bullishly to an earnings miss and bearishly to an earnings beat.
Options traders, particularly those who are holding close dated calls or puts, take on extra risk because the institutions writing the options increase premiums to account for implied volatility.
Want direct analysis? Find me in the BZ Pro lounge! Click here for a free trial.
The Ford Chart: Ford opened Wednesday’s trading session with an inside bar pattern and briefly tried to break up from Tuesday’s mother bar before dropping under Tuesday’s high-of-day. Despite the earnings report coming after the market close, Ford saw average volume, which indicates traders may be waiting to see Ford’s results before entering into a position.
Ford started trading in an uptrend on Oct. 13, with the most recent higher high formed on Oct. 18 at $12.25 and the most recent higher low printed at the $11.68 mark on Oct. 21. If Ford receives a bullish reaction to its earnings print and soars higher, the stock may temporarily stall at the 50-day simple moving average and retrace.
If Ford suffers a bearish reaction and forms a lower low, the uptrend will be negated and a downtrend may form. If Ford falls only slightly, the stock may find support at the eight-day and 21-day exponential moving averages, which are trending at about $12.40.
Ford has resistance above at $14.34 and $15.53 and support below at $12.79 and $11.99.
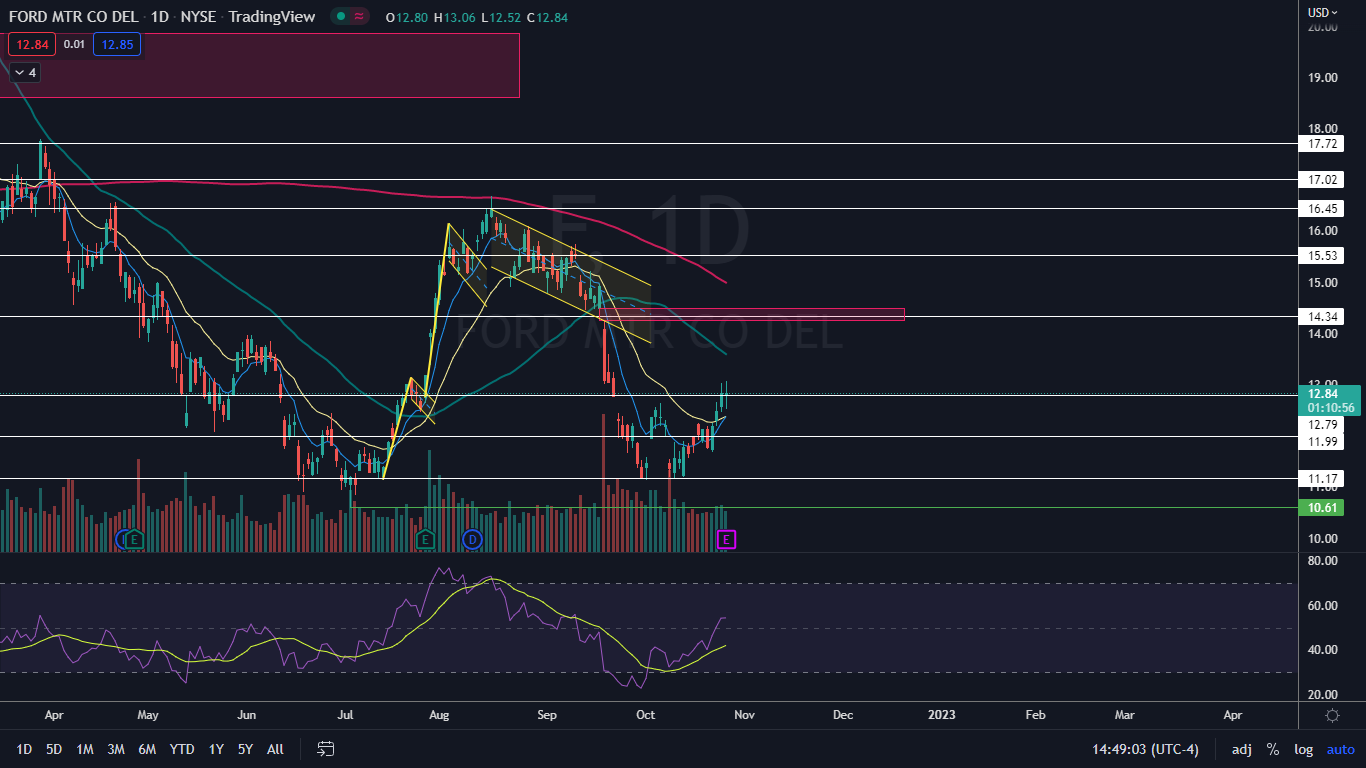
Photo via Shutterstock.