Etsy, Inc (NASDAQ:ETSY) was sliding almost 2% lower Wednesday, heading into its third-quarter earnings print expected after the close.
For the second quarter, the handmade and vintage e-commerce platform reported EPS of 51 cents on revenue of $585.14 million. Both numbers topped consensus analyst estimates of 34 cents and $557.25 million, respectively.
The day following the results, Etsy surged almost 10% and continued to soar over the next 13 trading days, rising an additional 15%.
For the third quarter, analysts, on average, expect Etsy to report earnings per share of 37 cents on revenues of $564.48 million.
Heading into the event, BofA Securities analyst Curtis Nagle maintained a Neutral rating on Etsy and cut the price target from $120 to $110. Nagle said Amazon.com, Inc’s (NASDAQ:AMZN) lower-than-expected retail revenue guidance for the current quarter is a signal Etsy may also struggle.
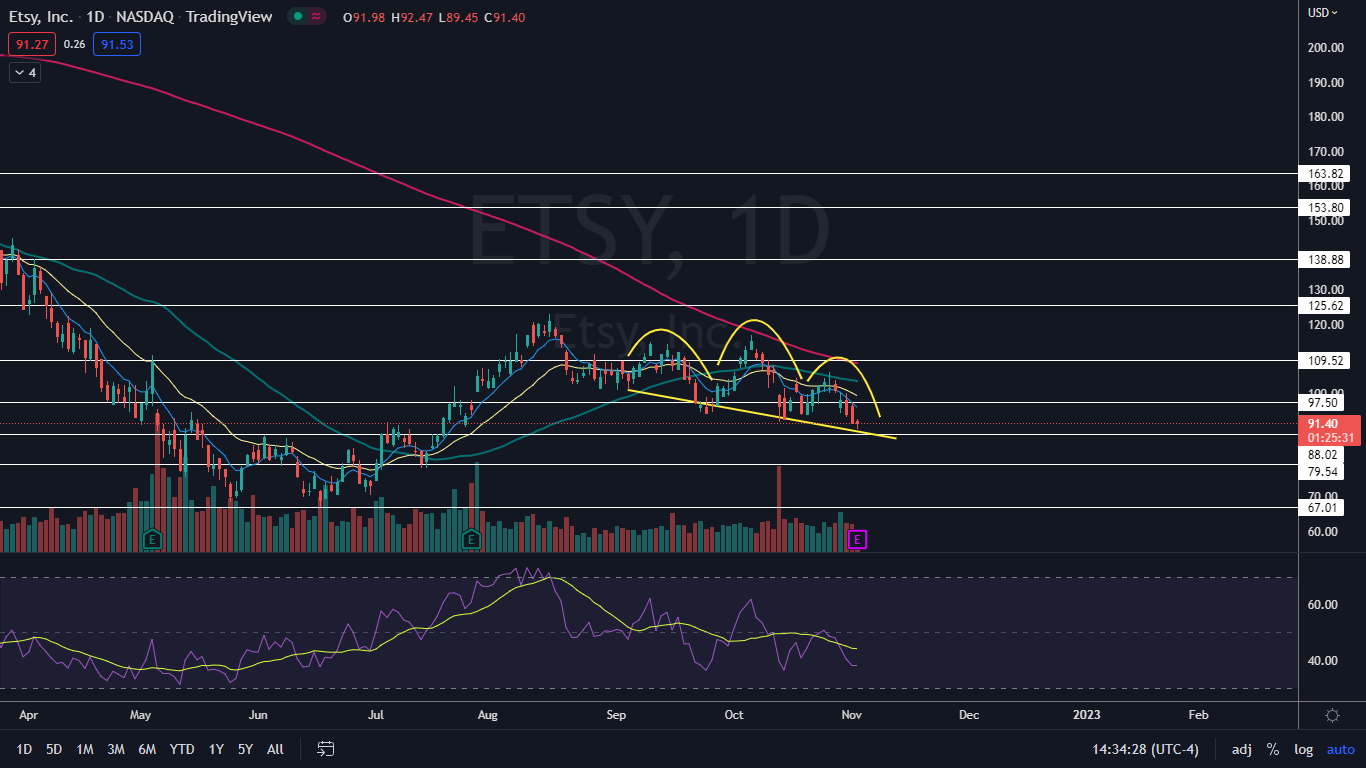
From a technical analysis perspective, Etsy’s stock looks neutral heading into the event, having settled into a possible bearish head-and-shoulders pattern but bullishly holding above the neckline of the formation.
It should be noted that holding stocks or options over an earnings print is akin to gambling because stocks can react bullishly to an earnings miss and bearishly to an earnings beat.
The Etsy Chart: Etsy’s head-and-shoulder pattern started to form on Sept. 6, with the left shoulder printed between that date and Sept. 26. The head formed between Sept. 27 and Oct. 19 and the right shoulder was created over the trading days that have followed.
- If Etsy suffers a bearish reaction to its earnings print and breaks down from the descending neckline of the pattern on higher-than-average volume, the measured move is about 24%, which indicates the stock could fall toward the $72 mark.
- If Etsy receives a positive reaction to the print, continues to hold above the neckline and bounces, the head-and-shoulders pattern will be negated but the current downtrend remains in play.
- Etsy’s most recent downtrend started on Oct. 6 and was confirmed to be intact on Wednesday when the stock printed a lower low under the Oct. 19 low of $94.33. The most recent lower high was formed on Oct. 26 at $106.20.
- The downtrend will negate if Etsy soars up to print a high above $107.
- Etsy has resistance above at $97.50 and $109.52 and support below at $88.02 and $79.54.

Photo via Shutterstock.


