Last week, we talked about a common way to trade earnings-related volatility. After searching for a situation where the option chain was implying a move that far differed from the average earnings move, we found an opportunity to trade underpriced volatility. The example: Netflix (NFLX) straddles.
But straddles aren’t the only way to make a volatility-based trade. Often, earnings week sees overpriced options — implied moves that are far greater than the average earnings move. But that doesn’t mean you have to sit out. It’s actually an opportunity to collect premium by taking the other side of the volatility trade.
This week another swath of companies are set to report earnings. Amongst the hundreds of companies set to report, we’ve found an opportunity to do just that in Skechers (SKX). First, let’s look back at last week’s example — a long-volatility trade.
Looking Back at Netflix Earnings Straddles
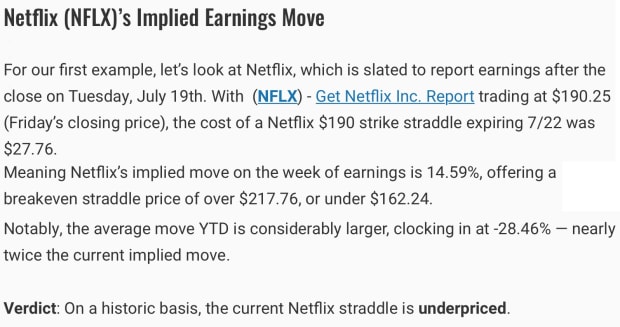
After analyzing the average size of historic earnings moves in Netflix and comparing those to the implied move of the at-the-money options on the week of earnings, we concluded that Netflix straddles were likely underpriced ahead of the print. That conclusion proved correct.
By Friday, the $190 NFLX straddle expiring 7/22 traded as high as $39.85 (43.5% higher than the $27.76 entry price), before closing the day at $30.44.
It’s worth reiterating a point from the same article we’re referencing — nothing in options trading is guaranteed. But by analyzing moves of the past, and adding our knowledge of options and volatility, we can stack probability in our favor.
Now that was a long volatility trade — a prediction that the options were underpriced. Let’s look at a trade that takes the other side of that strategy using an example from a stock that’s set to report earnings after hours on Tuesday the 26th: Skechers (SKX).
Want to learn how to collect option premium like the pros? Try Smart Spreads. With the help of powerful technical analysis, Chief Option Strategist Ryan Mastro uses credit spreads to make premium collection painless.
Shorting Volatility in Skechers Using Short Iron Condors
The option chain in footwear company Skechers (SKX) is implying a +/-10.19% move by the end of the week. But is that high or low given the earnings backdrop?
How to Tell if Volatility is High
There are a few ways to determine if option buyers are paying a fair price for options in Skechers.
The first way to analyze volatility is to look at macro volatility. A simple way to do this is by analyzing the VIX volatility index. According to a YTD analysis of CBOE volatility data, the average VIX closing price for 2022 is 26.39 — ~13% higher than the current VIX reading of 23.36.
VIX Conclusion: On a YTD basis, macro volatility is currently below average.
Another way to analyze volatility is through the stock itself by using IV rank. IV rank compares a stock’s current implied volatility to its volatility each day of the past year. Currently, Skechers’ IV rank is 95%, meaning that the implied volatility has only been higher 5% of the time over the past year.
IV Rank Conclusion: On a year-over-year basis, Skechers implied volatility is far above average.
However, Skechers is about to report earnings. That means this stock is prone to price moves that are larger-than-usual. But we can measure that too. By looking back at Skechers’ previous single-day earnings moves over the past 4 quarters (4.0%), we can make a final judgment of Skechers option prices.
Implied Move vs Average Earnings Move Conclusion: Skechers implied move of 10.19% is 154.75% higher than the 4.0% average earnings move.
The Verdict on Volatility: Skechers options look overpriced here. If historic averages hold up, a short-volatility play is one strategy that could give option traders a statistical edge in Skechers.
How to Create a Short-Volatility Option Trade
As we said above, trading options is all about putting probability in your favor as much as possible. To do that, traders can use a short iron condor. Short iron condors are a four-legged option strategy that combines two short credit spreads — one using calls, and one using puts — to make a prediction that a stock will trade within a predetermined range by the expiration date selected.
Interested in premium collection? Check out Time Bandit Options. Learn how to master the iron condor with two professionally crafted trade ideas from a licensed CMT every week.
In order to create a short iron condor, we’ll need to determine where to place the option legs. To start, we know that the average earnings move in Skechers is 4.0% — we’ll want our area of max profitability to remain comfortably outside that zone. But let’s add another layer to our thesis by looking at the chart in Skechers.
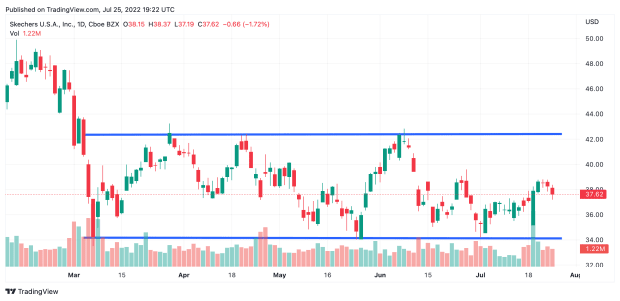
From early March to the present day, Skechers has generally respected the $42-$34 trading range — a range that is more than 21% wide, and of which Skechers is currently in the center of. Placing our range of profitability directly outside of this trading range will offer our short-volatility trade example an additional advantage.
Example Trade: A trader looking to short volatility in Skechers could use a short iron condor to sell the $43/$42 call credit spread and the $33/$34 put credit spread expiring 7/29. At the time of writing, that spread offers a max credit of $0.33 for a max risk of $0.67. This example trade has two breakeven points — under $42.33 (+11.69%), and above $33.67 (-11.16%). This means that Skechers has an opportunity to make a move more than twice the size of its average earnings move without challenging the breakevens of the trade.
The Bottom Line
First, let’s be clear: this is NOT a trade recommendation. You should always do your own due diligence before entering a trade.
However, this is an example of how option traders can strategically use data like average historical earnings moves, IV Rank, and macro volatility to search for opportunities where a particular option chain may be overpricing — or underpricing volatility.