Trying to read a chart without volume would be like trying to put together a puzzle with only half of the pieces. Volume contextualizes the price action of a stock, tells us whether institutional investors were behind the move.
If your stock hits a new high with lower volume, this could be a sign that a downward reversal is on the horizon.
As IBD has discussed, a stock does not make significant moves without institutional investors. The presence of big investors such as mutual funds, banks, and insurance companies is typically what drives a stock into new high ground. When these institutional investors are active in a stock, you can see it in the volume.
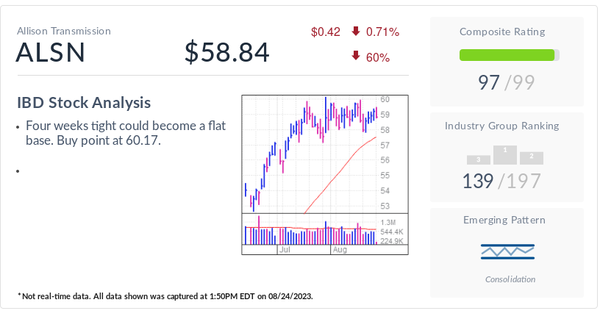
Pull up a weekly chart of a stock at IBD Stock Checkup or IBD MarketSurge. At the bottom of the chart, you'll see red and blue vertical bars. Those bars represent how many shares a stock traded during each week. Blue are up weeks and red are down weeks. At a glance, you can see the amount of volume with each price move.
How To Sell Stocks Reading Volume
The red line drawn across the volume bars is the 10-week moving average of the stock's volume. Calculated just like the moving averages for a stock's price, the line plots how many shares were traded over the previous 10 weeks divided by 10. This helps you see if volume was above or below average on a given week.
On a daily chart, the same concept applies using a 50-day moving average.
If volume is trending lower as the stock is hitting new highs, take note. That tells you the big money of institutional buyers is no longer there. Without them, sellers may now exert greater influence over the stock's future price moves.
This bearish trend of new price highs in declining volume is best seen in weekly charts.
Too Close To The Sun
In April 2022, Suncor Energy was up more than 25% from a June 2021 to January 2022 base-on-base pattern and back near pre-pandemic levels.
By the end of the month, the stock found support at the 10-week moving average. The Canadian energy giant rebounded on news of a collaboration with activist investment firm Elliot Management (1).
Institutional support was evident as volume swelled that week (2). A further three consecutive weeks up brought Suncor to its highest level since 2018.
However, the big money was fading. Each week the price moved higher, volume moved lower (3). The divergence of price and volume led to a long retreat in the stock.
In the week ended June 17, institutional investors cashed in their chips. Suncor fell 17% with volume spiking 32% above average (4).
Without the big money, Suncor did not have the foundation necessary to support the new highs. The decrease in volume was a clear sell signal to investors, growing louder each week.
This article was originally published Aug. 24, 2023, and has been updated.


