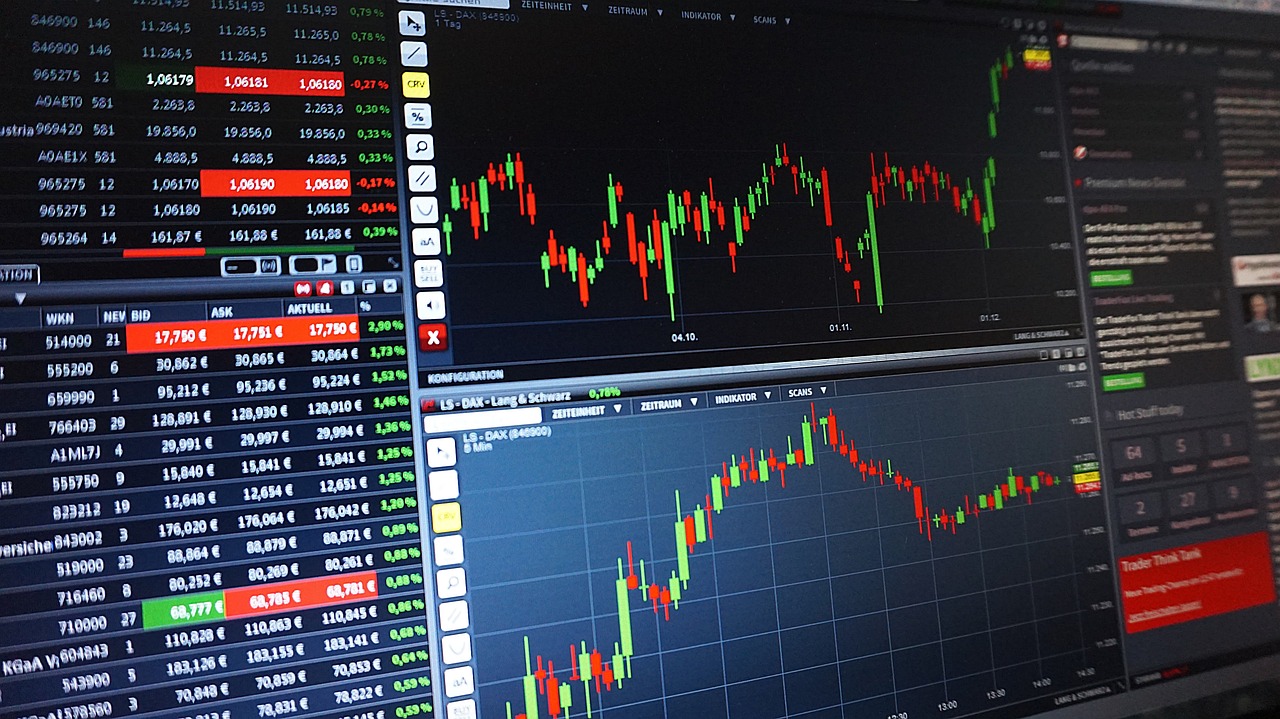
What if you could see every angle of the market in one view? With Barchart’s Grid Charts, you can. Whether you’re scanning dozens of tickers, comparing multiple timeframes, or building a custom strategy dashboard, Grid Charts give you professional-level insights without the complexity.
In this walkthrough, we’ll show you how to use Grid Charts across Interactive Charts, Flipcharts, and Dashboards — and how to save your setups as templates so you never have to rebuild them.