
The No. 1 state where retirees rely on Social Security isn’t California or Hawaii. New research from GOBankingRates reveals 41% of West Virginia households heavily depend on these benefits.
Why do retirees in such a low cost-of-living state lean on Social Security this much? As it turns out, West Virginia is one of the few states where it’s possible to fund retirement on Social Security alone. According to an October 2025 Realtor.com analysis, these benefits are sufficient enough to cover all essential living costs once retirees have paid off their mortgages.
To determine how much Americans rely on Social Security income, GOBankingRates studied key data like the population ages 65 and over, the number of households receiving retirement income and Social Security income, and the average amounts of said income for the households that receive it in each state. From there, the percentage of households that receive Social Security income and retirement income were calculated and the average total income from retirement and Social Security income was calculated.

Key Findings
- West Virginians depend on Social Security the most out of any state. In the Mountain State, 41% of households are supposed by these benefits while 29% of households rely on retirement income.
- At least 36% of households receive Social Security benefits in the top six states. Aside from West Virginia at 41%, the remaining five states include Hawaii (37.8%), Maine (37.5%), Delaware (36.7%), Florida (36.6%) and Vermont (36.4%).
- Social Security income makes up at least 25% of household income in 49 states. Utah is the only state where Americans rely the least on these benefits, at 23.9%.
- Retirees still need significant retirement savings across the majority of the United States. There are only three states where the total income from Social Security and retirement income amounts to more than $65,000 annually: Hawaii ($65,275), Alaska ($66,262) and Maryland ($66,781).
Here’s how much Americans rely on Social Security in every state. Also, take a look at how far $1.5 million in retirement savings and Social Security goes across the United States.
Learn More: GOBankingRates Original Research Center
See Next: 6 Safe Accounts Proven To Grow Your Money Up To 13x Faster

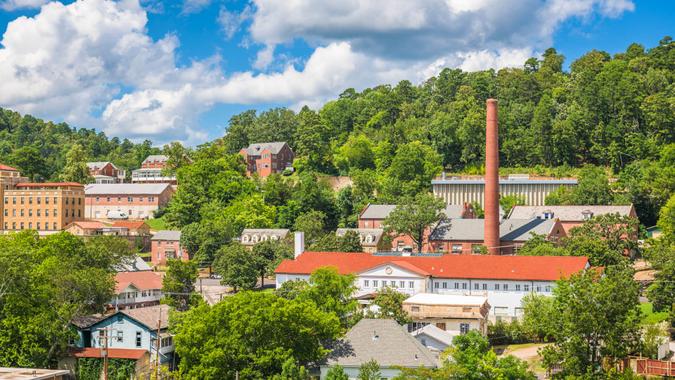
1. West Virginia
- % households with Social Security income: 41%
- Average Social Security income for households that receive it: $23,454
- % of households with retirement income: 29%
- Average retirement income for households that receive it: $25,596
- Total income from Social Security and retirement income: $49,050
Find Out: What Will the Average Social Security Check Be for Retirees in 2026?
Read Next: Social Security Just Made a Major Change — Act Now To Protect Your Retirement

2. Hawaii
- % households with Social Security income: 37.8%
- Average Social Security income for households that receive it: $25,701
- % of households with retirement income: 31%
- Average retirement income for households that receive it: $39,574
- Total income from Social Security and retirement income: $65,275
Be Aware: How Much Is Donald Trump’s Social Security Check — And Is He Collecting It?

3. Maine
- % households with Social Security income: 37.5%
- Average Social Security income for households that receive it: $23,788
- % of households with retirement income: 27.5%
- Average retirement income for households that receive it: $30,624
- Total income from Social Security and retirement income: $54,412

4. Delaware
- % households with Social Security income: 36.7%
- Average Social Security income for households that receive it: $27,237
- % of households with retirement income: 32.3%
- Average retirement income for households that receive it: $36,430
- Total income from Social Security and retirement income: $63,667

5. Florida
- % households with Social Security income: 36.6%
- Average Social Security income for households that receive it: $24,828
- % of households with retirement income: 25.7%
- Average retirement income for households that receive it: $36,158
- Total income from Social Security and retirement income: $60,986

6. Vermont
- % households with Social Security income: 36.4%
- Average Social Security income for households that receive it: $25,636
- % of households with retirement income: 26.3%
- Average retirement income for households that receive it: $30,380
- Total income from Social Security and retirement income: $56,016

7. New Mexico
- % households with Social Security income: 35.8%
- Average Social Security income for households that receive it: $22,744
- % of households with retirement income: 26.3%
- Average retirement income for households that receive it: $34,486
- Total income from Social Security and retirement income: $57,230
View More: 90% of Americans Plan To Skip This Social Security Advice — and It Could Cost Them

8. Mississippi
- % households with Social Security income: 35.5%
- Average Social Security income for households that receive it: $21,900
- % of households with retirement income: 23.4%
- Average retirement income for households that receive it: $27,572
- Total income from Social Security and retirement income: $49,472

9. Alabama
- % households with Social Security income: 35.2%
- Average Social Security income for households that receive it: $23,538
- % of households with retirement income: 25.7%
- Average retirement income for households that receive it: $29,495
- Total income from Social Security and retirement income: $53,033

10. South Carolina
- % households with Social Security income: 35.1%
- Average Social Security income for households that receive it: $24,889
- % of households with retirement income: 27.1%
- Average retirement income for households that receive it: $30,648
- Total income from Social Security and retirement income: $55,537

11. Pennsylvania
- % households with Social Security income: 35.1%
- Average Social Security income for households that receive it: $24,783
- % of households with retirement income: 27.3%
- Average retirement income for households that receive it: $29,353
- Total income from Social Security and retirement income: $54,136
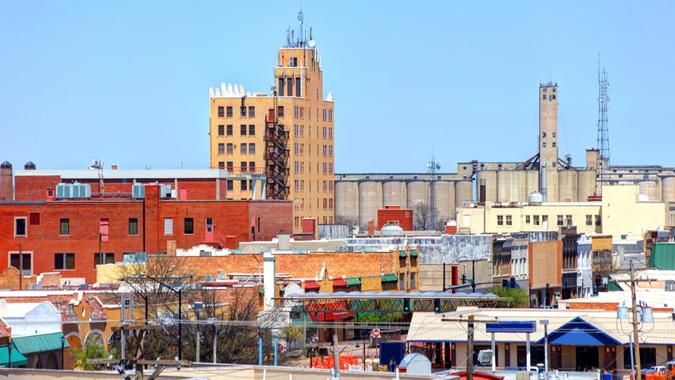
12. Arkansas
- % households with Social Security income: 35%
- Average Social Security income for households that receive it: $23,099
- % of households with retirement income: 23.3%
- Average retirement income for households that receive it: $25,775
- Total income from Social Security and retirement income: $48,874
That’s Interesting: How Much Is Barbara Corcoran’s Social Security Check?

13. Michigan
- % households with Social Security income: 34.9%
- Average Social Security income for households that receive it: $25,306
- % of households with retirement income: 28.1%
- Average retirement income for households that receive it: $28,787
- Total income from Social Security and retirement income: $54,093

14. New Hampshire
- % households with Social Security income: 34.9%
- Average Social Security income for households that receive it: $26,038
- % of households with retirement income: 27.5%
- Average retirement income for households that receive it: $32,744
- Total income from Social Security and retirement income: $58,782

15. Montana
- % households with Social Security income: 34.7%
- Average Social Security income for households that receive it: $23,719
- % of households with retirement income: 25%
- Average retirement income for households that receive it: $31,521
- Total income from Social Security and retirement income: $55,240

16. Kentucky
- % households with Social Security income: 34.6%
- Average Social Security income for households that receive it: $22,523
- % of households with retirement income: 25.8%
- Average retirement income for households that receive it: $28,217
- Total income from Social Security and retirement income: $50,740

17. Arizona
- % households with Social Security income: 34%
- Average Social Security income for households that receive it: $25,846
- % of households with retirement income: 26.6%
- Average retirement income for households that receive it: $33,780
- Total income from Social Security and retirement income: $59,626
Explore Next: Oprah Winfrey’s Social Security Check vs. the Average American’s

18. Rhode Island
- % households with Social Security income: 33.7%
- Average Social Security income for households that receive it: $24,173
- % of households with retirement income: 25.4%
- Average retirement income for households that receive it: $32,100
- Total income from Social Security and retirement income: $56,273

19. Oregon
- % households with Social Security income: 33%
- Average Social Security income for households that receive it: $25,228
- % of households with retirement income: 25.4%
- Average retirement income for households that receive it: $33,866
- Total income from Social Security and retirement income: $59,094
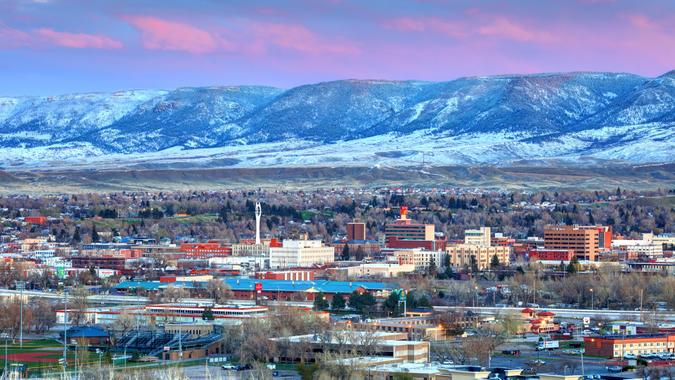
20. Wyoming
- % households with Social Security income: 32.9%
- Average Social Security income for households that receive it: $24,894
- % of households with retirement income: 26.3%
- Average retirement income for households that receive it: $32,160
- Total income from Social Security and retirement income: $57,054

21. Missouri
- % households with Social Security income: 32.8%
- Average Social Security income for households that receive it: $23,786
- % of households with retirement income: 25.7%
- Average retirement income for households that receive it: $28,692
- Total income from Social Security and retirement income: $52,478

22. Idaho
- % households with Social Security income: 32.8%
- Average Social Security income for households that receive it: $25,162
- % of households with retirement income: 25.6%
- Average retirement income for households that receive it: $31,767
- Total income from Social Security and retirement income: $56,929
Discover More: Here’s Who Should Really Be Worried About Social Security Cuts

23. Wisconsin
- % households with Social Security income: 32.7%
- Average Social Security income for households that receive it: $25,671
- % of households with retirement income: 26.9%
- Average retirement income for households that receive it: $30,282
- Total income from Social Security and retirement income: $55,953

24. Tennessee
- % households with Social Security income: 32.5%
- Average Social Security income for households that receive it: $24,229
- % of households with retirement income: 23.6%
- Average retirement income for households that receive it: $28,521
- Total income from Social Security and retirement income: $52,750

25. Connecticut
- % households with Social Security income: 32.2%
- Average Social Security income for households that receive it: $26,030
- % of households with retirement income: 26%
- Average retirement income for households that receive it: $37,230
- Total income from Social Security and retirement income: $63,260

26. New York
- % households with Social Security income: 32.2%
- Average Social Security income for households that receive it: $24,021
- % of households with retirement income: 24.8%
- Average retirement income for households that receive it: $35,144
- Total income from Social Security and retirement income: $59,165

27. Ohio
- % households with Social Security income: 32.1%
- Average Social Security income for households that receive it: $23,080
- % of households with retirement income: 26.3%
- Average retirement income for households that receive it: $30,541
- Total income from Social Security and retirement income: $53,621
View Next: How Much Is Larry Ellison’s Social Security Check?

28. North Carolina
- % households with Social Security income: 32%
- Average Social Security income for households that receive it: $24,506
- % of households with retirement income: 24.5%
- Average retirement income for households that receive it: $30,271
- Total income from Social Security and retirement income: $54,777

29. Oklahoma
- % households with Social Security income: 31.9%
- Average Social Security income for households that receive it: $23,616
- % of households with retirement income: 22.9%
- Average retirement income for households that receive it: $28,707
- Total income from Social Security and retirement income: $52,323

30. Louisiana
- % households with Social Security income: 31.8%
- Average Social Security income for households that receive it: $21,191
- % of households with retirement income: 21.8%
- Average retirement income for households that receive it: $29,728
- Total income from Social Security and retirement income: $50,919

31. Indiana
- % households with Social Security income: 31.8%
- Average Social Security income for households that receive it: $24,883
- % of households with retirement income: 25%
- Average retirement income for households that receive it: $24,630
- Total income from Social Security and retirement income: $49,513

32. Iowa
- % households with Social Security income: 31.6%
- Average Social Security income for households that receive it: $24,976
- % of households with retirement income: 24.4%
- Average retirement income for households that receive it: $27,133
- Total income from Social Security and retirement income: $52,109
For You: Here’s the Salary You Need To Make To Get the Maximum Social Security Benefit

33. New Jersey
- % households with Social Security income: 31.4%
- Average Social Security income for households that receive it: $26,170
- % of households with retirement income: 24.7%
- Average retirement income for households that receive it: $35,825
- Total income from Social Security and retirement income: $61,995

34. Nevada
- % households with Social Security income: 31.2%
- Average Social Security income for households that receive it: $23,650
- % of households with retirement income: 24.5%
- Average retirement income for households that receive it: $36,093
- Total income from Social Security and retirement income: $59,743

35. South Dakota
- % households with Social Security income: 31%
- Average Social Security income for households that receive it: $23,344
- % of households with retirement income: 22.1%
- Average retirement income for households that receive it: $28,314
- Total income from Social Security and retirement income: $51,658
36. Kansas
- % households with Social Security income: 30.7%
- Average Social Security income for households that receive it: $25,491
- % of households with retirement income: 24.6%
- Average retirement income for households that receive it: $28,694
- Total income from Social Security and retirement income: $54,185

37. Massachusetts
- % households with Social Security income: 30%
- Average Social Security income for households that receive it: $24,428
- % of households with retirement income: 23%
- Average retirement income for households that receive it: $36,843
- Total income from Social Security and retirement income: $61,271
Discover Next: 3 Little-Known Social Security Rules That Could Save You Thousands

38. Minnesota
- % households with Social Security income: 30%
- Average Social Security income for households that receive it: $25,927
- % of households with retirement income: 24.3%
- Average retirement income for households that receive it: $30,828
- Total income from Social Security and retirement income: $56,755

39. Virginia
- % households with Social Security income: 29.9%
- Average Social Security income for households that receive it: $25,098
- % of households with retirement income: 26.8%
- Average retirement income for households that receive it: $38,965
- Total income from Social Security and retirement income: $64,063

40. Georgia
- % households with Social Security income: 29.3%
- Average Social Security income for households that receive it: $23,669
- % of households with retirement income: 22.4%
- Average retirement income for households that receive it: $31,564
- Total income from Social Security and retirement income: $55,233

41. Nebraska
- % households with Social Security income: 29.3%
- Average Social Security income for households that receive it: $24,993
- % of households with retirement income: 21.7%
- Average retirement income for households that receive it: $28,510
- Total income from Social Security and retirement income: $53,503

42. Illinois
- % households with Social Security income: 29.2%
- Average Social Security income for households that receive it: $24,173
- % of households with retirement income: 23.9%
- Average retirement income for households that receive it: $36,075
- Total income from Social Security and retirement income: $60,248
Check Out: Social Security Full Retirement Age Went Up This Month — Why It May Continue To Rise

43. Washington
- % households with Social Security income: 29%
- Average Social Security income for households that receive it: $26,009
- % of households with retirement income: 24.1%
- Average retirement income for households that receive it: $35,403
- Total income from Social Security and retirement income: $61,412

44. Maryland
- % households with Social Security income: 28.5%
- Average Social Security income for households that receive it: $25,101
- % of households with retirement income: 26.1%
- Average retirement income for households that receive it: $41,680
- Total income from Social Security and retirement income: $66,781

45. California
- % households with Social Security income: 28.4%
- Average Social Security income for households that receive it: $23,818
- % of households with retirement income: 21.7%
- Average retirement income for households that receive it: $40,267
- Total income from Social Security and retirement income: $64,085
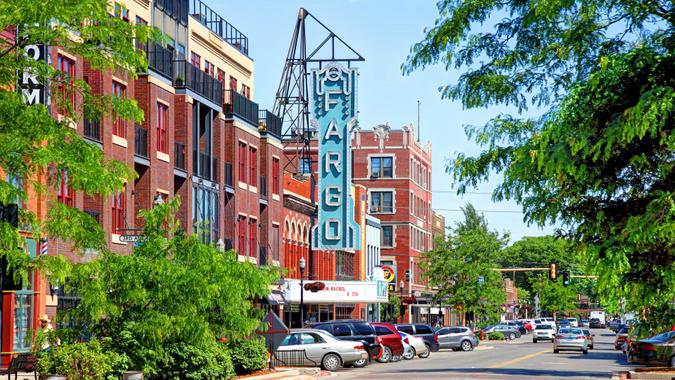
46. North Dakota
- % households with Social Security income: 28%
- Average Social Security income for households that receive it: $23,520
- % of households with retirement income: 19.7%
- Average retirement income for households that receive it: $28,888
- Total income from Social Security and retirement income: $52,408

47. Alaska
- % households with Social Security income: 25.6%
- Average Social Security income for households that receive it: $22,327
- % of households with retirement income: 24.3%
- Average retirement income for households that receive it: $43,935
- Total income from Social Security and retirement income: $66,262
Trending Now: How Much the Average Upper Class Retiree Claims in Social Security Benefits at Age 65

48. Colorado
- % households with Social Security income: 25.6%
- Average Social Security income for households that receive it: $24,827
- % of households with retirement income: 22.3%
- Average retirement income for households that receive it: $37,797
- Total income from Social Security and retirement income: $62,624

49. Texas
- % households with Social Security income: 25.4%
- Average Social Security income for households that receive it: $23,233
- % of households with retirement income: 19.2%
- Average retirement income for households that receive it: $32,313
- Total income from Social Security and retirement income: $55,546

50. Utah
- % households with Social Security income: 23.9%
- Average Social Security income for households that receive it: $26,142
- % of households with retirement income: 20.6%
- Average retirement income for households that receive it: $33,767
- Total income from Social Security and retirement income: $59,909
Explore more original studies and surveys in the GOBankingRates original research center.
Methodology: All data comes from the U.S. Census 5-Year American Community Survey. The states were sorted to show the highest percentage of households that receive Social Security income. All data is up to date as of Feb. 3, 2026.
More From GOBankingRates
This article originally appeared on GOBankingRates.com: How Much Americans Rely on Social Security in Every State in 2026