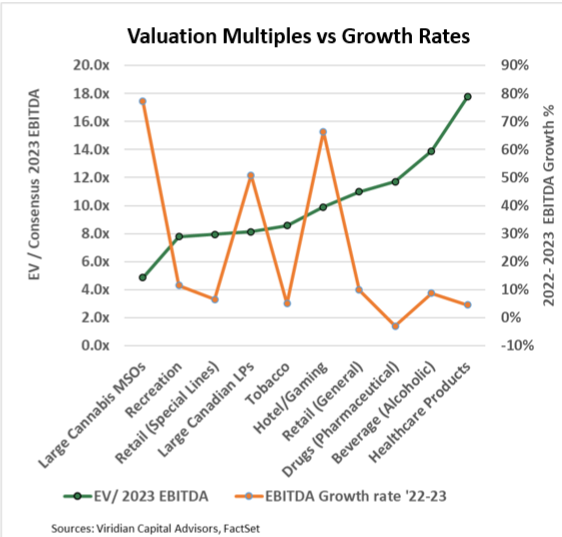
Faced with challenging industry dynamics, economic headwinds, and unresolved doubts regarding any federal regulatory reform, investors have become less willing to pay for rosy EBITDA growth projections.

The chart is based on data from 253 companies, arranged into ten industry groups. Several industries are often compared to cannabis, including Alcoholic Beverages, Tobacco, and Pharmaceutical Drugs. To aggregate data for each industry, we summed all enterprise values and EBITDA. The green line (measured on the left axis) shows enterprise value to 2023 consensus EBITDA estimates. The orange line shows the projected growth of EBITDA between 2022 and 2023.
U.S. Cannabis MSOs have the lowest EV / 2023 EBITDA values of any of the groups, and it is tempting to read this as an endorsement of the undervaluation of the sector. Another possibility, however, is that the market doesn’t believe the analysts’ projected 77% growth rate in cannabis EBITDA for 2023. Looking at 2022 multiples tells a different story: Recreation, Retail (special lines), and Tobacco are all within .3 points. Investors are right to question analysts’ 2023 projections as they have already been reduced by 37% YTD and still don’t adequately account for margins pressures from inflation and wholesale pricing weakness.
The market is ascribing the highest 2023 multiples to sectors that don’t need much growth to achieve their 2023 projections.
With the tremendous uncertainty surrounding the industry and economy, investors would be wise to “bullet-proof” their portfolios with companies that neither require additional capital to survive nor significant growth to provide value. High EBITDA growth is still likely, and the SAFE act is still our base case, but they should be happy surprises, not the primary investment thesis.
The Viridian Capital Chart of the Week highlights key investment, valuation and M&A trends taken from the Viridian Cannabis Deal Tracker.
The Viridian Cannabis Deal Tracker provides the market intelligence that cannabis companies, investors, and acquirers utilize to make informed decisions regarding capital allocation and M&A strategy. The Deal Tracker is a proprietary information service that monitors capital raise and M&A activity in the legal cannabis, CBD, and psychedelics industries. Each week the Tracker aggregates and analyzes all closed deals and segments each according to key metrics:
-
Deals by Industry Sector (To track the flow of capital and M&A Deals by one of 12 Sectors - from Cultivation to Brands to Software)
-
Deal Structure (Equity/Debt for Capital Raises, Cash/Stock/Earnout for M&A) Status of the company announcing the transaction (Public vs. Private)
-
Principals to the Transaction (Issuer/Investor/Lender/Acquirer) Key deal terms (Pricing and Valuation)
-
Key Deal Terms (Deal Size, Valuation, Pricing, Warrants, Cost of Capital)
-
Deals by Location of Issuer/Buyer/Seller (To Track the Flow of Capital and M&A Deals by State and Country)
-
Credit Ratings (Leverage and Liquidity Ratios)
Since its inception in 2015, the Viridian Cannabis Deal Tracker has tracked and analyzed more than 2,500 capital raises and 1,000 M&A transactions totaling over $50 billion in aggregate value.
The preceding article is from one of our external contributors. It does not represent the opinion of Benzinga and has not been edited.


