/Roper%20Technologies%20Inc%20logo%20and%20website-by%20T_Schneider%20via%20Shutterstock.jpg)
Valued at a market cap of $48 billion, Roper Technologies, Inc. (ROP) designs and develops vertical software and technology-enabled products. The Sarasota, Florida-based company provides software and engineering solutions to healthcare, industrial, transportation, and niche enterprise end markets.
Companies valued at $10 billion or more are typically classified as “large-cap stocks,” and ROP fits the label perfectly, with its market cap exceeding this threshold, underscoring its size, influence, and dominance within the software - application industry. The company’s business model is driven by disciplined capital allocation and strategic acquisitions, enabling it to continually expand its portfolio into data- and software-centric segments with durable demand.
This software company has slipped 25% from its 52-week high of $595.17, reached on Mar. 5. Shares of ROP have declined 15.3% over the past three months, lagging behind the SPDR S&P Software & Services ETF’s (XSW) 2.3% drop during the same time frame.
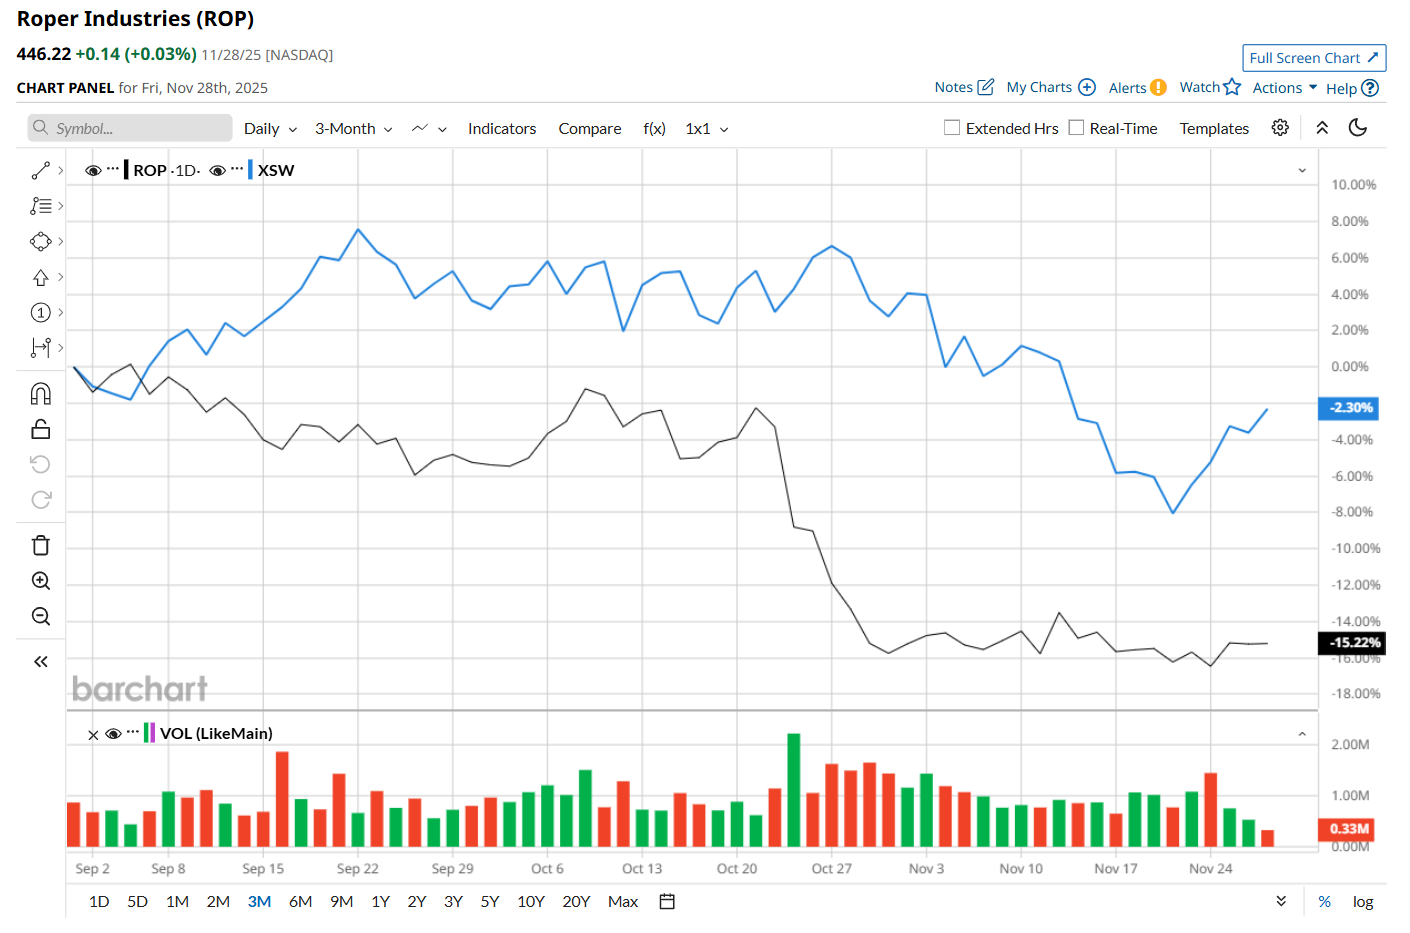
In the longer term, ROP has fallen 20.9% over the past 52 weeks, notably underperforming XSW's 3.9% downtick over the same time period. Moreover, on a YTD basis, shares of ROP are down 14.2%, compared to XSW’s 1.4% loss.
To confirm its bearish trend, ROP has been trading below its 200-day moving average since late July, and has remained below its 50-day moving average since early July.
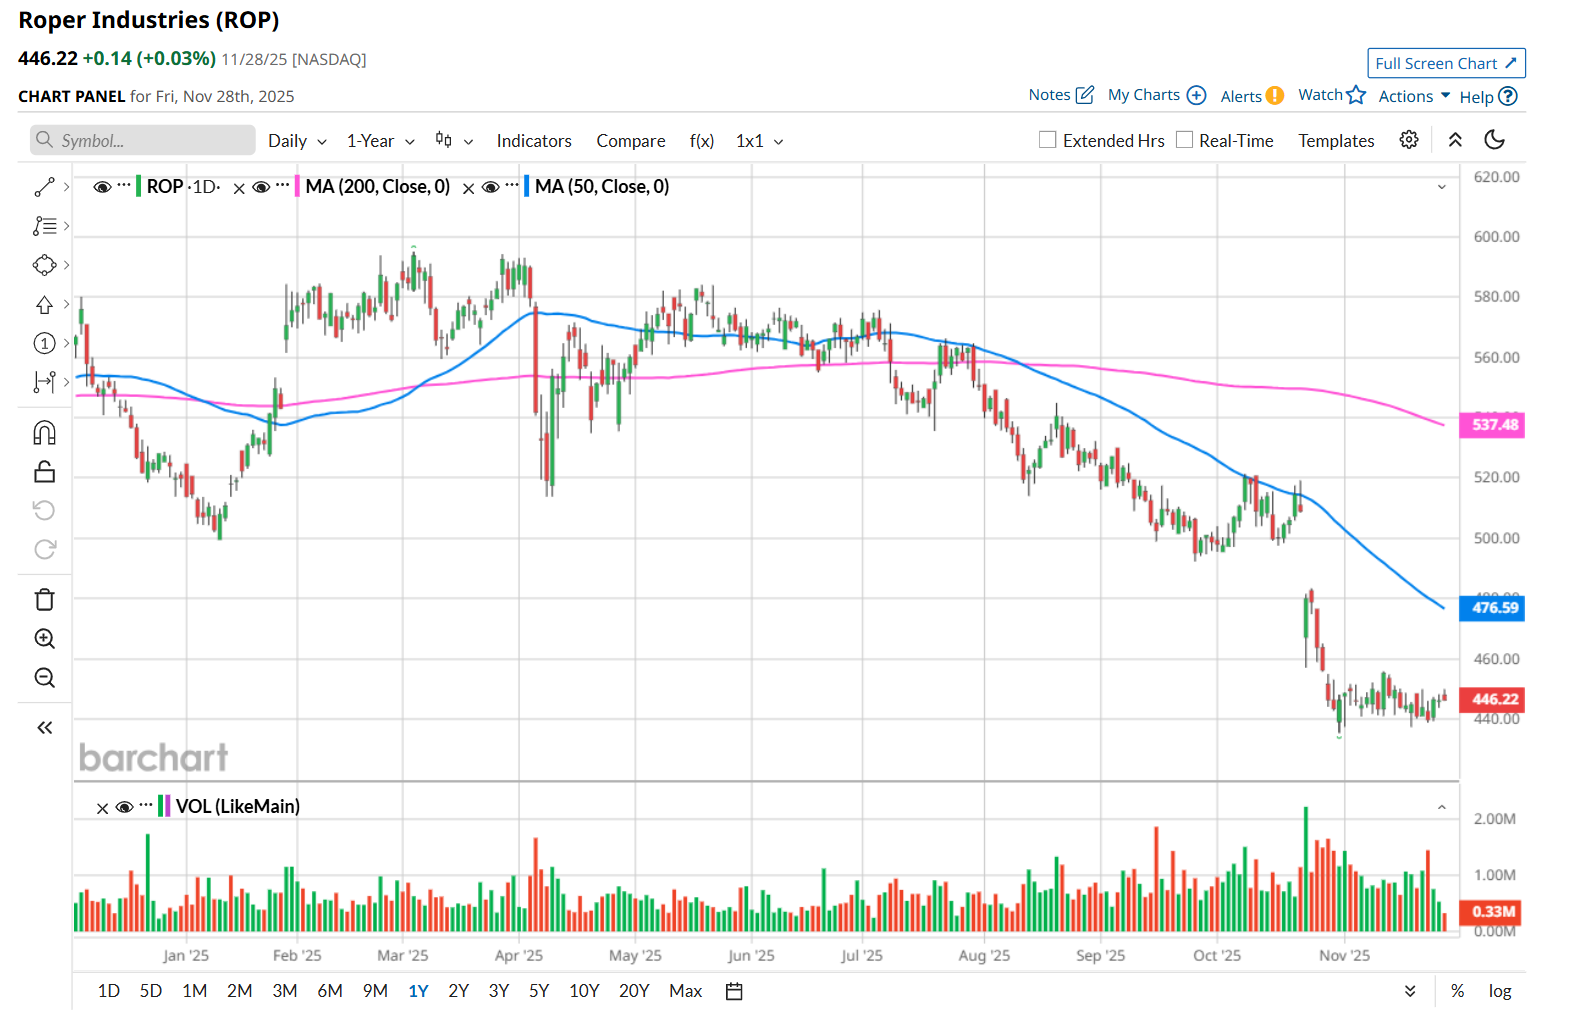
On Oct. 23, shares of ROP plunged 5.7% after its Q3 earnings release, despite beating Wall Street’s earnings estimates by a slight margin. The company posted adjusted EPS of $5.14, up 11.3% from the year-ago quarter and marginally ahead of analyst estimates. Meanwhile, its revenue also improved 14.3% year-over-year to $2 billion, meeting consensus expectations. However, ROP lowered its fiscal 2025 adjusted EPS guidance range to $19.90 to $19.95, down from the previous range of $19.90 to $20.05, which might have made investors jittery.
Nonetheless, ROP has outperformed its rival, Tyler Technologies, Inc. (TYL), which declined 25.5% over the past 52 weeks and 18.6% on a YTD basis
Despite ROP’s recent underperformance, analysts remain moderately optimistic about its prospects. The stock has a consensus rating of "Moderate Buy” from the 18 analysts covering it, and the mean price target of $575.93 suggests a 29.1% premium to its current price levels.