Cannabis stocks have been on fire over the past couple of days and when we look around the market, it’s not too surprising.
For starters, the stock market has done pretty well. The S&P 500 has wavered so far on Friday, but is close to flat on the session. It’s rallied in six of the past eight sessions, with one of those declines coming in at just 0.03% — I’d prefer to call it flat.
Regardless, we’ve obviously had a “risk-on” rally over the last two weeks.
Further, we’ve seen prior short-squeeze candidates like GameStop (GME) and AMC Entertainment (AMC) come roaring back to life.
Now we’re seeing cannabis stocks heat up, with Canopy Growth (CGC) and Tilray (TLRY) rallying 27.2% and 47% from yesterday’s low to Friday’s high, respectively.
How high can these two stocks go?
Trading Canopy Growth Stock
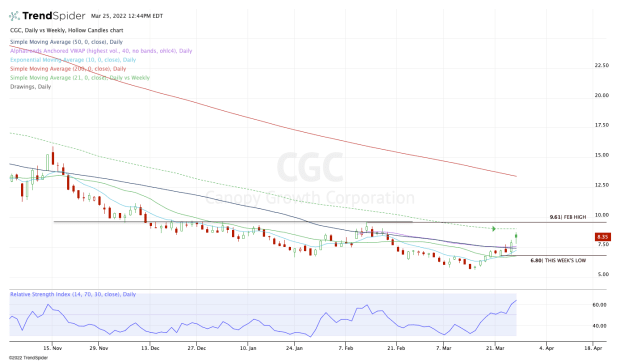
Chart courtesy of TrendSpider.com
On Thursday, Canopy Growth stock gave bulls its first close above the 50-day moving average and the daily VWAP measure since mid-February.
On Friday, the stock pulled back from its early, but found its footing above these key measures and bounced back to the upside. From here, I’m keeping a close eye on the 21-week moving average and the February high up at $9.61.
The 21-week moving average came into play as resistance near the November high — which ended up being the fourth-quarter high.
If the stock is able to clear this mark, I believe it could open the door to the $9.50 to $9.60 area and last month’s high. You’ll also notice that this area has been a key support and resistance area over the past several quarters.
To clear it would be significant and open the door to $10-plus.
On the downside, keep an eye on the 50-day and the daily VWAP. Below both measures puts this week’s low in play at $6.80. Below that and we could be looking at a test of the 2022 low at $5.62.
Trading Tilray Stock
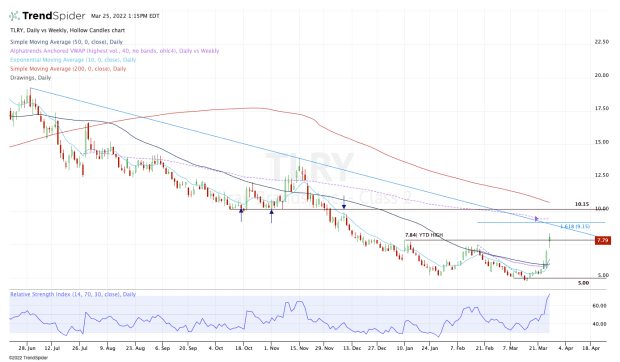
Chart courtesy of TrendSpider.com
Tilray has been the more explosive of the two stocks, but most would consider it a lower-quality holding vs. Canopy.
With Friday’s powerful push, Tilray stock is rotating over last month’s high near $7.50 and the year-to-date high at $7.84.
I would keep a close eye on Friday’s low and Thursday’s high between $7.25 and $7.07, respectively. If the stock loses that level, then we could be looking at a test of the 10-day moving average and the daily VWAP measure.
On a move below the 50-day, the key $5 level could be back in play.
As for the upside, a continued move higher could put the $9 to $9.50 area in play. In this zone, Tilray will find downtrend resistance (blue line), the 161.8 extension from the March low to the February high and the weekly VWAP measure.
Above all of that could put $10 and the 200-day in play.