Ford Motor Company (NYSE:F) popped 6.54% higher on Thursday, partly filling a gap that was left behind on Sept. 20.
On Friday, the stock continued to push higher, completely filling that gap.
The stock moved higher in tandem with several other automakers, such as General Motors Company (NYSE:GM) and Lucid Group, Inc (NASDAQ:LCID), and alongside the general market, which saw the S&P 500 surge a whopping 5.54%.
See Also: Why Ford And GM Shares Are Exploding Higher
Consumer price index data released by the U.S. Bureau of Labor Statistics on Thursday morning showed inflation ticked lower in October, coming in at 7.7% versus the 8% estimate. The softer-than-expected number calmed recession fears among traders and investors and brought hopes the Federal Reserve may start to lessen its aggressive approach.
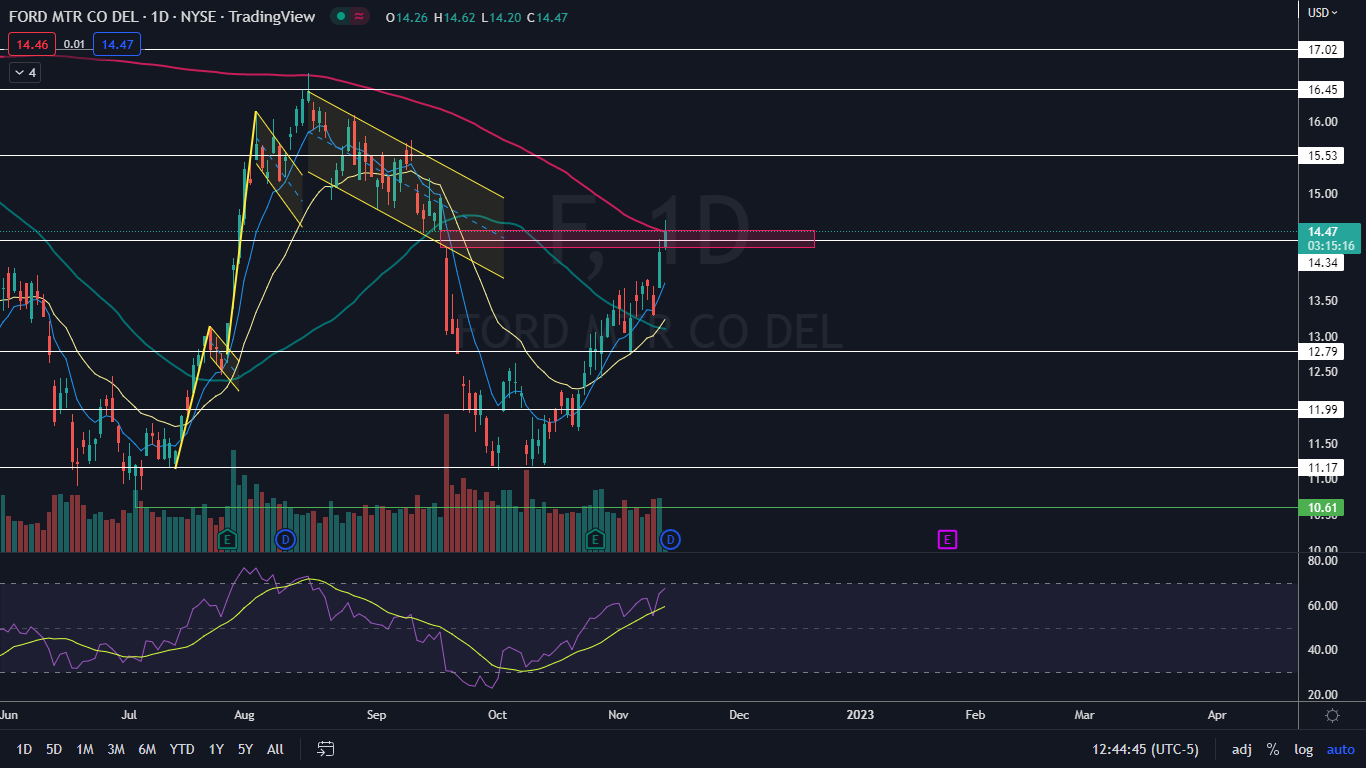
The spike on Friday saw Ford temporarily break through the 200-day simple moving average on the daily chart.
The 200-day SMA is an important bellwether. Technical traders and investors consider a stock trading above the level on the daily chart to be in a bull cycle, whereas a stock trading under the 200-day SMA is considered to be in a bear cycle.
The 50-day SMA also plays an important role in technical analysis, especially when paired with the 200-day. When the 50-day SMA crosses below the 200-day SMA, a death cross occurs whereas when the 50-day SMA crosses above the 200-day, a bullish golden cross takes place.
Want direct analysis? Find me in the BZ Pro lounge! Click here for a free trial.
The Ford Chart: Ford reversed into a daily uptrend on Oct. 11, with the most recent higher low printed on Wednesday at $13.28 and the most recent confirmed higher high printed at the $13.80 mark the day prior. On the weekly chart, Ford hasn’t retraced enough to print a higher low, which indicates a period of downward consolidation is likely imminent.
- A retracement may take under the 200-day SMA. The 200-day SMA acts as a solid resistance level when a stock is moving higher and because Ford was unable to fly through the area on the first attempt the stock may need to consolidate under the level for a period of time, possibly setting up a bull flag.
- A retracement is also likely on the horizon because Ford’s relative strength index (RSI) is measuring in at about 67%. When a stock’s RSI reaches or trades above the 70% level, it becomes overbought, which can be a sell signal for technical traders.
- If Ford closes the trading session under the 200-day SMA and with a long upper wick, the stock will print a shooting star candlestick, which could indicate a reversal for Monday. If the stock bursts through the 200-day to close the session near the high-of-day price, Ford will print a bullish Marubozu candlestick, which could indicate higher prices.
- Ford has resistance above at $14.34 and $15.53 and support below at $12.79 and $11.99.