
Alibaba Group Holdings, Ltd (NYSE:BABA) was trading up over 4% on Tuesday morning after closing Monday’s session down over 10%, in tandem with the general market. The S&P 500 is due for at least a relief bounce, having plunged about 10% over the past four trading days.
The Hangzhou-based e-commerce, internet and technology company has suffered numerous set-backs over the past few years, amid regulatory scrutiny and long-lasting COVID-19 restrictions, including lockdowns that have outlasted, in both length and repetition, the complications faced by companies in the U.S. and Europe.
China recently re-imposed strict lockdowns after lifting restrictions just a few weeks ago. The country is battling outbreaks it finds difficult to control with its Sinopharm vaccine, despite claiming the inoculation to be 95% effective against preventing intensive care unit admissions.
The general market has also hampered a recent bullish break across a number of China-based stocks, which began to soar toward the end of May, when China began to ease regulatory oversight on its home-based companies in order to revive its struggling economy.
Despite the sharp decline on Monday, Alibaba is holding on, albeit weakly, to an uptrend that began on May 26, when the stock broke up bullishly from a falling channel pattern on the daily chart.
Want direct analysis? Find me in the BZ Pro lounge! Click here for a free trial.
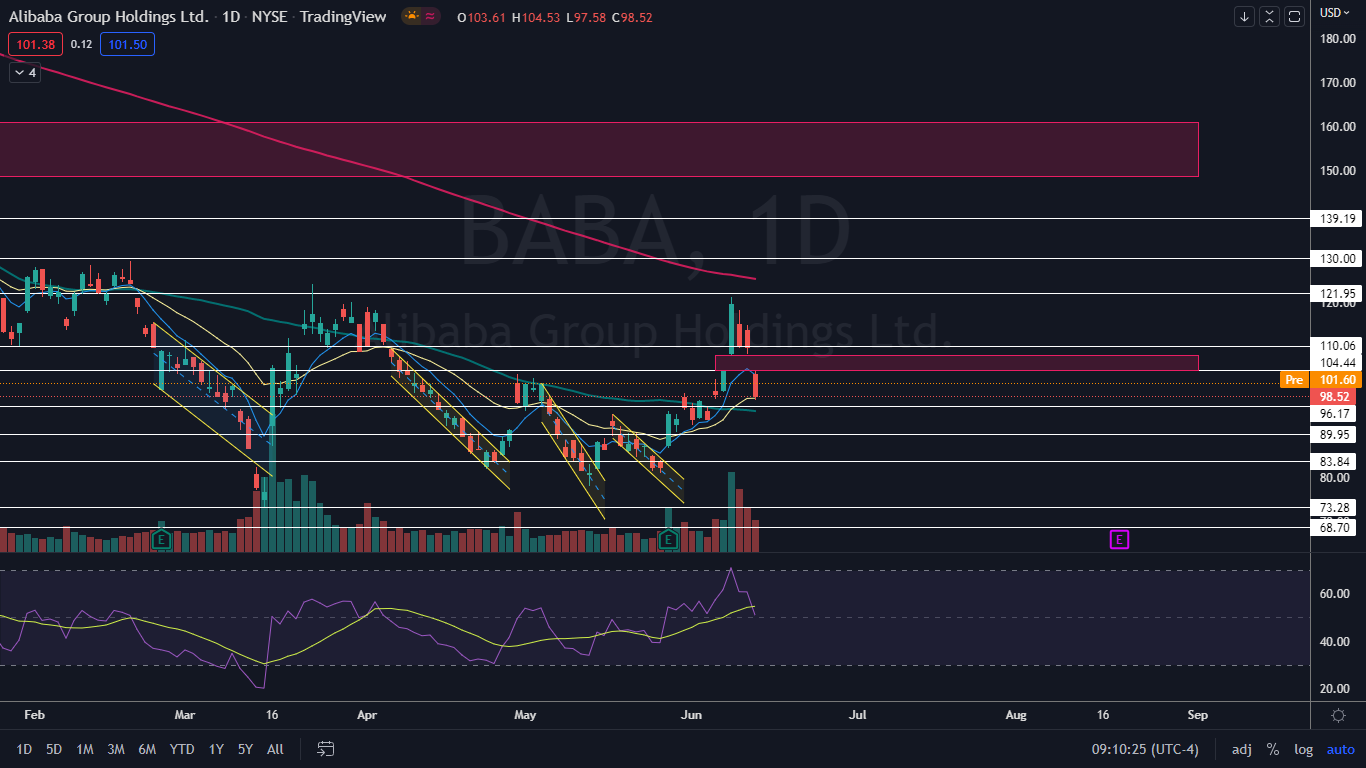
The Alibaba Chart: Although Alibaba succumbed to heavy weakness on Monday, the stock is trading in an uptrend, with the most recent higher high printed on June 8 and $121.06 and the most recent higher low formed at the $93.02 level on June 3. If Alibaba falls further over the coming days but prints a bullish reversal candlestick above the $93 mark, the uptrend is likely to continue.
- The bears will be hoping the bearish kicker candlestick pattern that Alibaba printed on Monday indicates the stock will trade lower on Tuesday and negate the uptrend. Monday’s bearish price action came on lower-than-average volume, however, which indicates fear has yet to grip the stock and that the move lower could be consolidation.
- The three-day decline that’s taken place between Thursday and Monday has helped to drop Alibaba’s relative strength index to 50%. Having an RSI near that level indicates the stock has room to move in either direction without becoming oversold, and favors neither the bulls nor the bears.
- Alibaba has multiple gaps above on its chart, with the first having been created on Monday between $104.32 and $107.81. Gaps on charts fill about 90% of the time, which makes it likely the stock will bounce up into the empty trading range in the future.
- Alibaba has resistance above at $104.44 and $110.06 and support below at $96.17 and $89.95.
See Also: How to Read Candlestick Charts for Beginners
Photo: Courtesy of alibaba.com